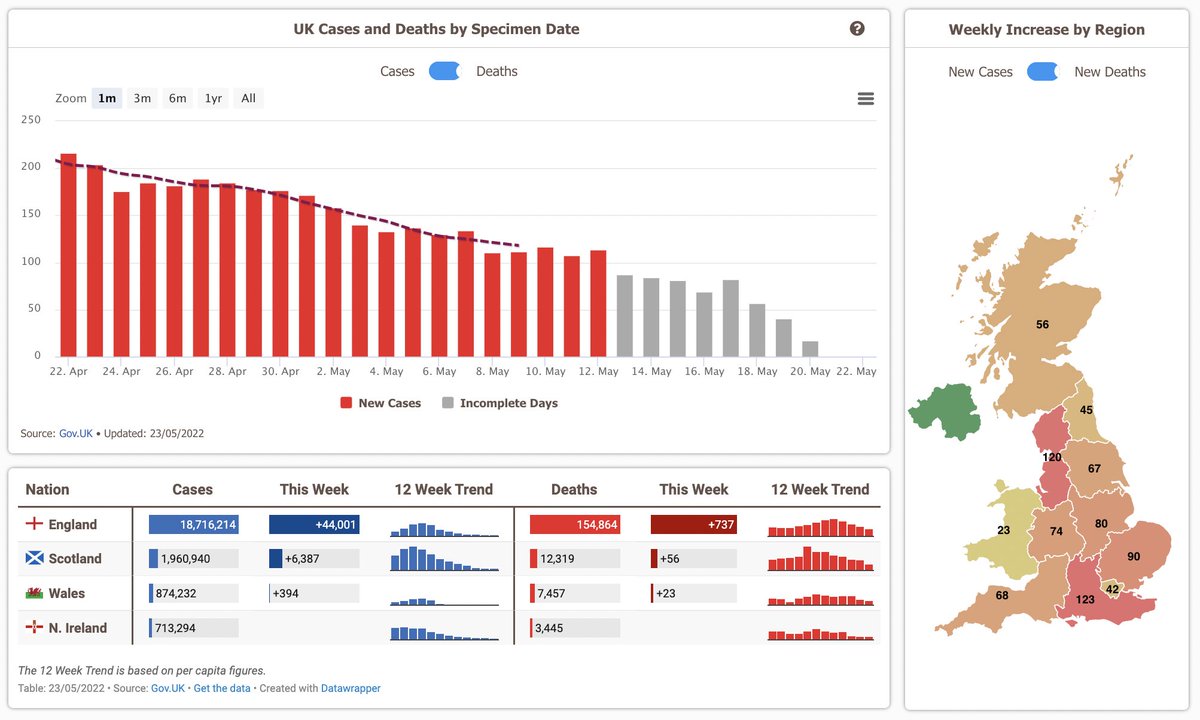
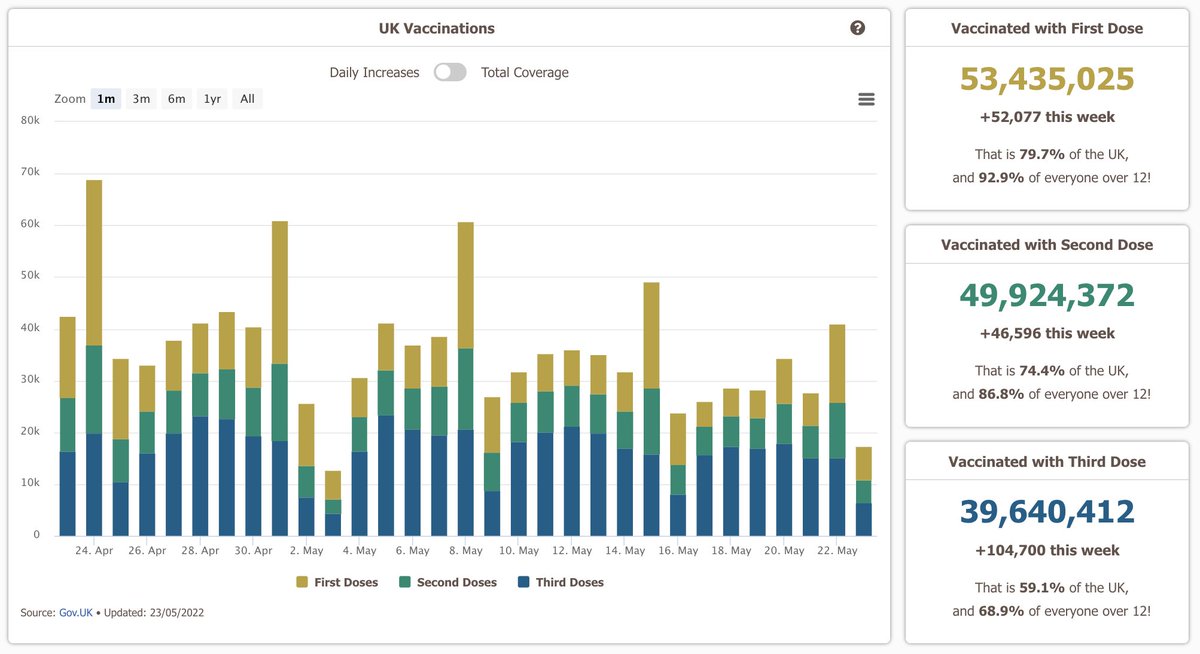
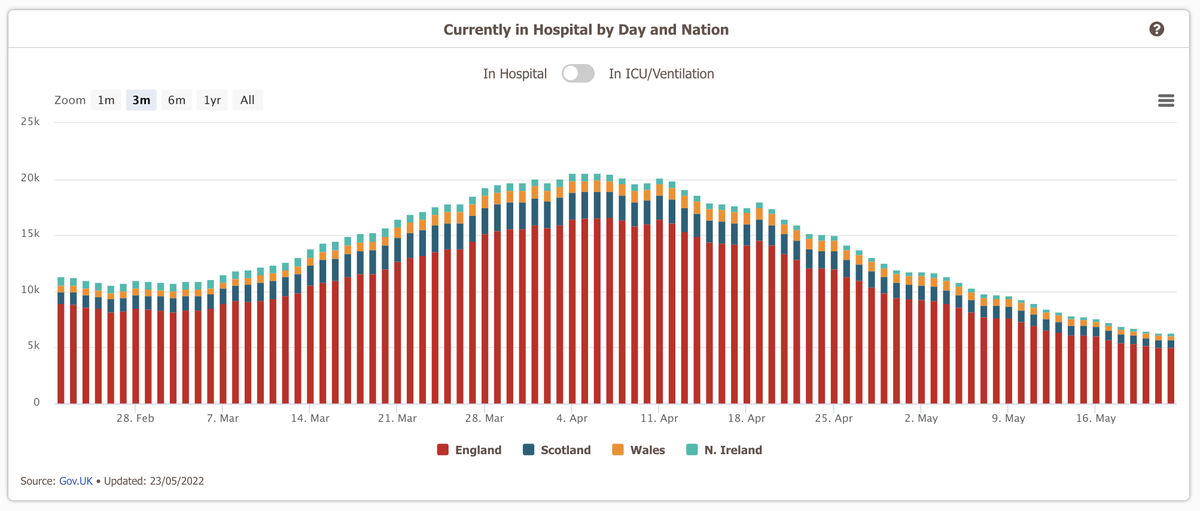
As of today, Northern Ireland will no longer be releasing any case or death data, so going forward those figures on the page will just be for England / Scotland / Wales.
And of course, the ONS Infection survey will still be running, giving an alternative for case figures in Northern Ireland.
The figures there will be more accurate, although not as timely, and not as useful at a local level
You may still see some 'new this week' or trends of case and death figures for Northern Ireland on the page, but they will all be at 0 by this time next week
I'll need to do a proper update to account for the changes, but I'm away from home right now so it is tricky
Also, Wales will no longer be releasing daily data after this Thursday (instead they'll be releasing weekly data each Thursday), and next Wednesday Scotland (and my pages) will switch from twice a week updates to just once a week updates (on Wednesday).
• • •
Missing some Tweet in this thread? You can try to
force a refresh
Having a lazy day today, so I thought I would share a thread discussing some of the data still being released, and what I think is the most useful to look at when trying to assess risk the current situation (primarily focusing on Scotland)! 🧵
So obviously testing is waaaay down. We're currently averaging about 22,000 tests a day, down from about 150,000 a day at the start of the year.
Most people aren't eligible for free tests anymore (just the groups shown below), and private tests aren't included in the figures.
Meaning the tests (and cases) still being reported are from people using up their stockpile of LFTs, and those in the previously shown tweet.
Once the stockpiles are used up, I'm hoping the testing numbers will level out, and from there case figures will become more useful again
When I started this page, I was 24... and now I'm 27 😮
Can't believe it has been going on that long! 😅
But as it has been a while, I thought I would share a thread about the page and where it is going... 🧵
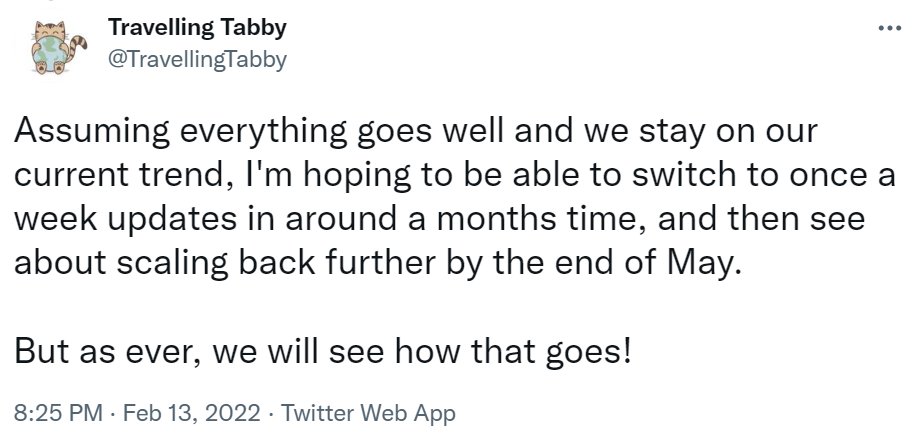
Back in February, I was hoping to switch to weekly updates in March and then scale back further in May. Evidently, that didn't happen..
With case rates spiking so much, and the general anxiety surrounding the lifting of restrictions, I didn't think it was appropriate to do that.
For most people (especially after the vaccination rollout), the virus isn't as much of a concern anymore, and checking the figures every day isn't all that useful.
That is reflected when I look at the page traffic, which is at its lowest level since 2020! 📉
Also, all of the changes I mentioned for the Scotland page in my earlier update are also happening on the UK page, with the same timescales being used for the weekly figures
The latest figures from the ONS Infection Survey estimate that 1 in 30 people in Scotland currently has Covid-19, which is down from 1 in 25 last week, and 1 in 19 the week before!
I just wanted to quickly mention some changes to the page. Mostly just about some of the charts that I've removed, and a couple of other small changes!
As a reminder, neither the Scotland or UK page will be updated until Wednesday.
So firstly, on the Scotland page, this chart was removed. It hasn't been updated for over a month anyways 😅
A gift for us all: there will be no data released on Christmas Day or Boxing Day, so we can try to put the current situation into the back of our minds.. for a couple of days at least!
Here is a full schedule for the next couple of weeks!
There will be some English data being released on the red days (other than Christmas/Boxing day), but I still won't be updating the UK page as it would be England only. I'll try to tweet out some of the figures though!
During the break, I'm hoping to make some changes too. Mostly it will just be removing old/uninteresting charts, to try and make the updates easier and improve the performance of the page.
I'll tweet out about anything that is removed or changed though!