#THREAD
Almost every colleague I worked with had one chart open on their Bloomberg terminals.
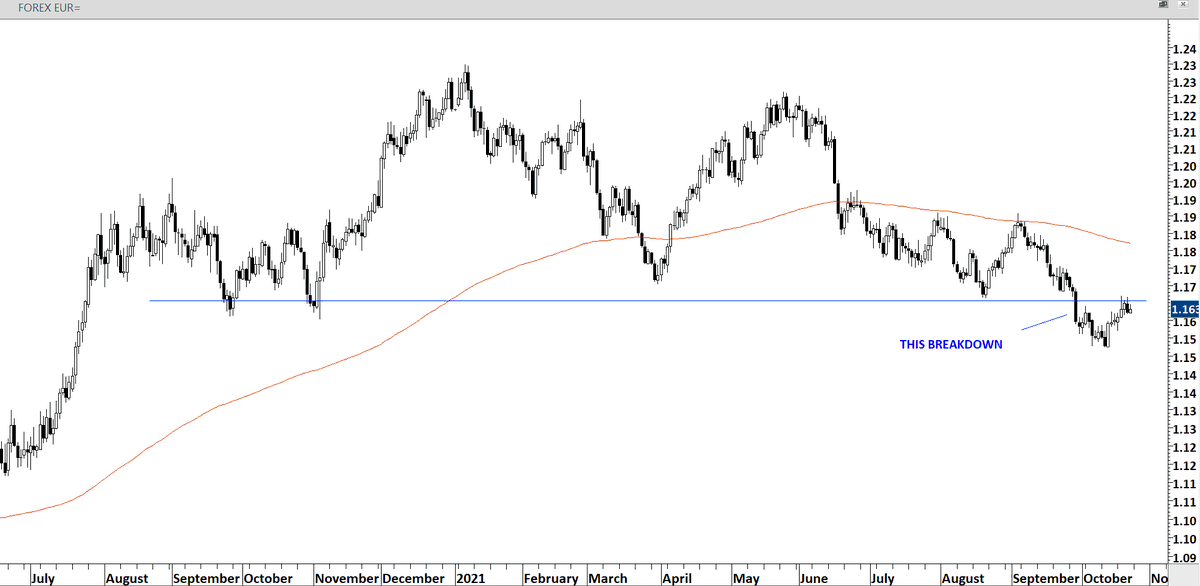
They were reading fundamental research requiring quarterly basis action but their charts were daily scale and sometimes even intraday. (1)
Almost every colleague I worked with had one chart open on their Bloomberg terminals.
They were reading fundamental research requiring quarterly basis action but their charts were daily scale and sometimes even intraday. (1)
Your time frame of research/decision making should match the time period of your charts.
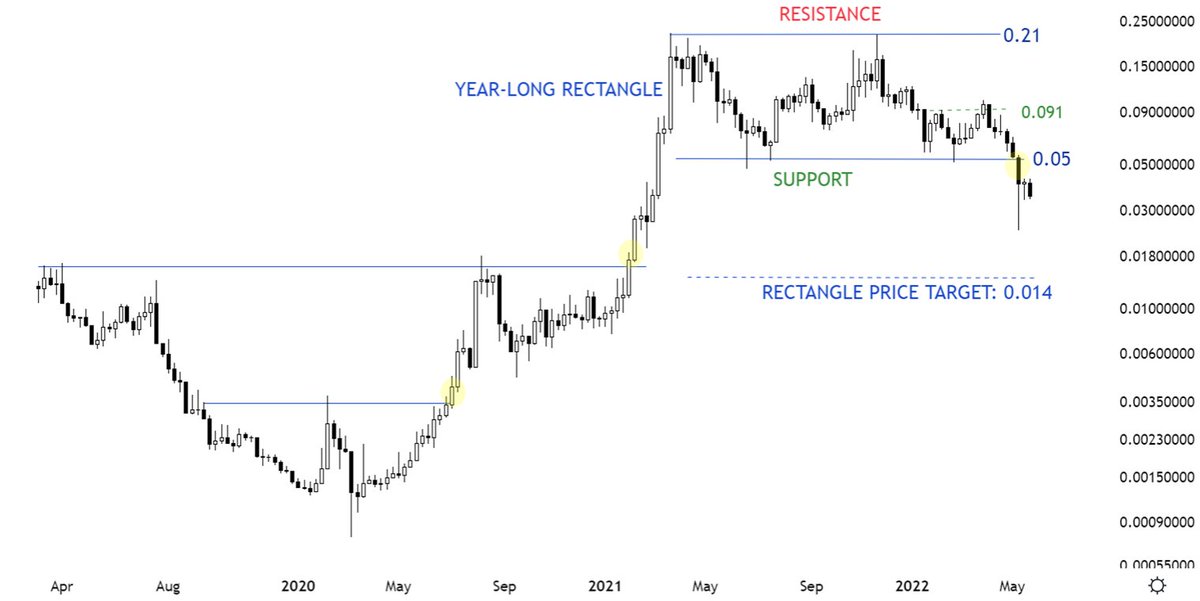
If you are running a portfolio and focusing on trends of several months duration, your charts should be weekly & monthly. (2)
If you are running a portfolio and focusing on trends of several months duration, your charts should be weekly & monthly. (2)
Trends of this magnitude can only be captured on long-term charts given that you haven't depleted your patience capital on daily and intraday price charts.
Pick your time frame, make peace with it and stick to it.
Pick your time frame, make peace with it and stick to it.
• • •
Missing some Tweet in this thread? You can try to
force a refresh