Aksel Kibar, CMT Profile picture
Chartered Market Technician (CMT) and Classical chart trader. Ex- Fund manager. Premium membership ➡️ https://t.co/Y3Q8Y9Flke YouTube ➡️ https://t.co/GDPhOs0GwD
Seenu.A Profile picture xtrader73 Profile picture Spartacus Profile picture Andy_CryptoBot Profile picture Gabriel Mare Profile picture 13 subscribed
Jan 11, 2023 4 tweets 2 min read
#THREAD A text-book example that we can learn many fine points of classical charting and technical analysis. $LAUL.NS #INDIA #SENSEX #NIFTY 1) A well-defined horizontal boundary being tested several times before a breakout or breakdown.
Oct 13, 2022 8 tweets 2 min read
A #thread on impatience and regret cycle.

This is not about charts. It is about the frequently read and discussed trading journal and record keeping.

How it can help to overcome your impatience with an ongoing trade and the constant urge to do something about it. I'm a big believer of setting strategy/tactics and managing trades when markets are closed. I try to avoid making decisions when markets are open. I can't say I have fully mastered it but with today's technology it is becoming easier to resist the temptation to override decisions
Feb 5, 2022 5 tweets 2 min read
Taking one signal (clue) at a time. I usually like to go step by step. Don't read too much into charts. We can't see 4-5 steps ahead.

Here is how I analyzed $IWC Image 
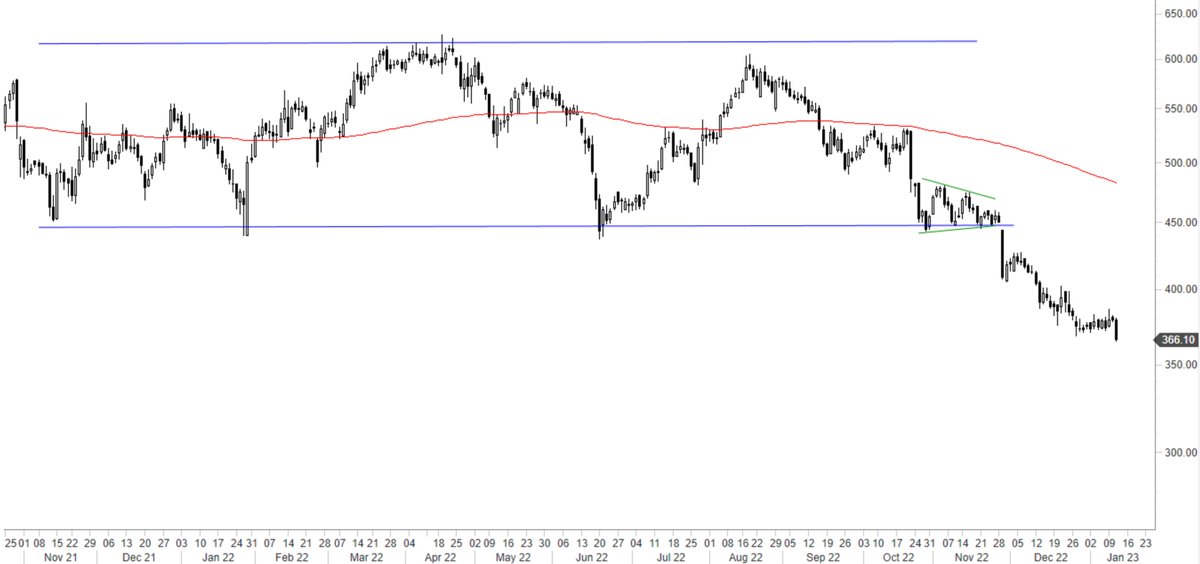
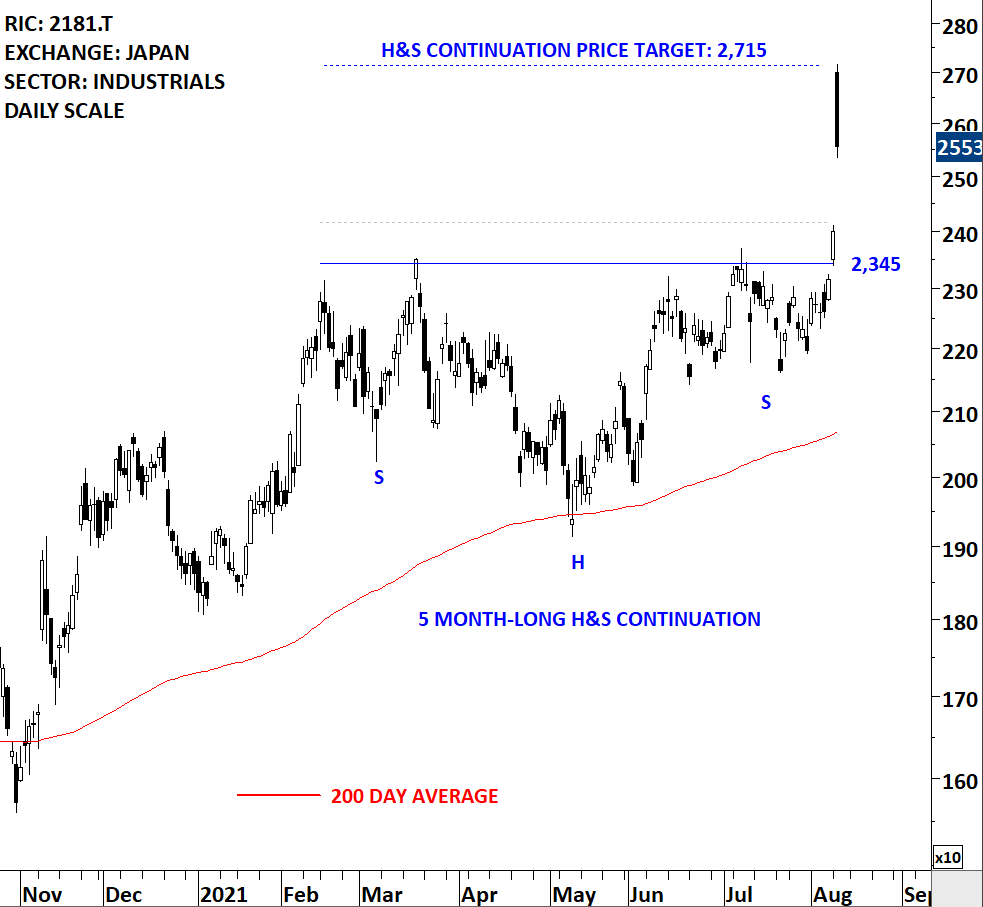
In following week's update what I was looking on price chart. $IWC Image
Dec 5, 2021 4 tweets 2 min read
Another nugget for you.

If you have identified a set of 100 or let's say 500 instruments to review...

Unless you make it a habit to review them each day around the same time, you will miss opportunities and lack the visual training as patterns develop. 1 year of data loaded on daily scale chart. We look at the right side of the chart to find horizontal setup with several tests of pattern boundary.

Do you now see what we are looking for?
Dec 3, 2021 4 tweets 2 min read
I don't trade those short-term H&S top patterns. For those who trade $MSFT can come under pressure for couple of days. Image $MSFT short-term H&S top neckline at 328.5. Lower boundary of an arguable trend channel at 310. Image
Oct 22, 2021 7 tweets 3 min read
Was this a pullback? We will find out in the next couple of trading sessions $EUR #FX Image Update on $EUR #FX Image
Oct 16, 2021 4 tweets 2 min read
The way I tackle price charts:

From past price studies I have an idea of how price should behave around certain levels.

Then I say: If A happens then B is more likely. If I see B then it is a sign of C. #COPPER is a good example. I have been analyzing price action above the 200-day average. The rebounds have been weak.

I said if it remains weak, (A happens) then a breakdown and correction (B) is more likely.

Ideal situation in a reversion to the mean is a sharp rebound.
Oct 15, 2021 8 tweets 3 min read
It is ok to wait for confirmation. It is ok not to predict but get more info. from the chart itself and act.

This was when I concluded the breakout is valid and symmetrical triangle is completed. $BTC

Chart patterns are confirmed when they are mature. It is usually difficult to understand at what level the pattern is mature. For me this is with several tests of pattern boundary.

First reversal signal on $BTC was covered with this setup.

Oct 14, 2021 4 tweets 2 min read
I'm not in the business of picking tops and bottoms. I will never short an index like this.

However, I'm in the business of identifying extremes relative to past price actions.

#INDIA benchmarks are taking a parabolic shape with consecutive gap openings. #SENSEX #NIFTY Question I'm trying to answer, what are those gaps at all-time highs???

From Richard Schabacker:
Oct 14, 2021 4 tweets 2 min read
This is considered Type 2 breakout. (Explained in following videos).

Irrespective of time frame (note I don't analyze intraday price action), price dynamics are the same. Breakouts can be followed by pullbacks and those would ideally find support at the previous resistance. Piyasada birileri..., dis gucler, soros, vs. gibi inanclari olan arkadaslar icin Isvec borsasinda islem goren bir hissenin grafigini paylasiyorum.

Piyasadaki o "birileri" ne atfedilen hareketler aslinda kolletif olarak toplu suru piskolojisi/insan davranislarindan kaynaklaniyor
Oct 3, 2021 6 tweets 2 min read
Are you ready for a visual exercise? Qualities we will be looking for:

1) A clean horizontal boundary

2) Min 3 tests of the pattern boundary

3) If a short trade = needs to be below 200-day
If a long trade = needs to be above 200-day
Oct 3, 2021 5 tweets 1 min read
Define a research universe 500, 1000 names... depends on your time dedicated for market research each day & weekend.

Make sure you go through the same list every single day.

What you miss earlier you might capture later.

You see the development of price charts better Open each chart with the same template. Don't go into style drift by saying: Hmm.. let me see what X indicator is doing or let me go into hourly chart etc.

You have 1hr (or how much it takes to finish the list you have built) to finish the work and move off the screen.
Oct 3, 2021 4 tweets 1 min read
Weekends are dedicated for the review of weekly scale price charts. After the close of each trading day, review the end of day charts.

After the close of each trading week, review the end of week charts.

Repeat this for a month and you will develop a routine to review markets/patterns.
Sep 23, 2021 4 tweets 1 min read
(1) Let's study this chart and discuss some of the concepts in classical charting & technical analysis. It is a great chart. Image 
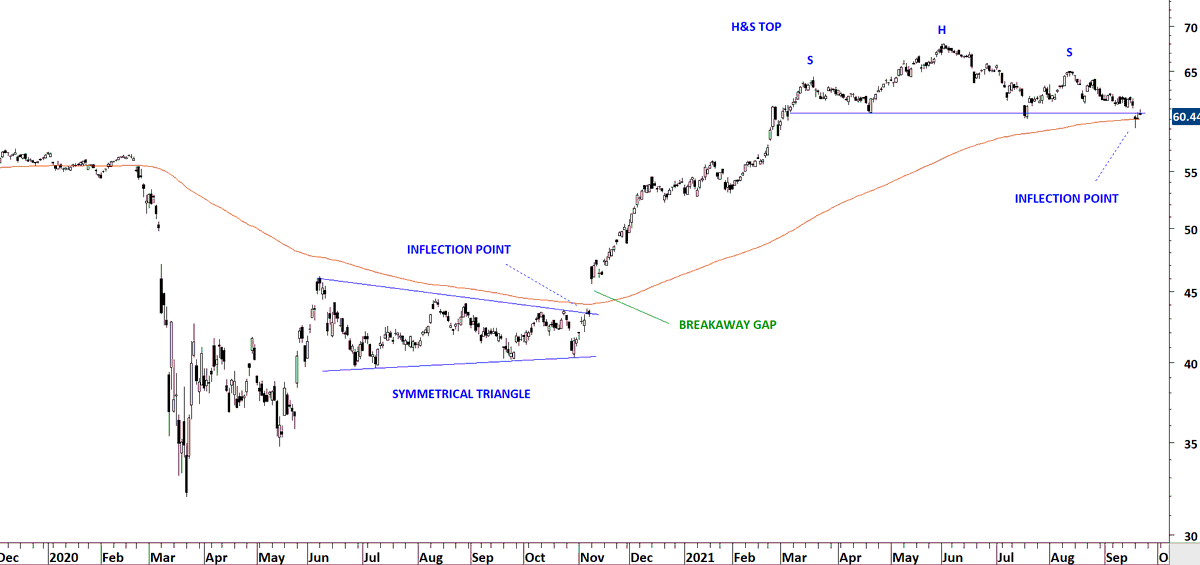
(2) Symmetrical triangle formed right below the 200-day average. Breakout took place at the same price level which I call inflection point. When such condition is met, it is a high conviction setup for me.
Sep 23, 2021 4 tweets 2 min read
Step by step analysis of price action around rising trend channels.

A breach above the upper boundary, if not followed by an acceleration on the upside, can result in a failed breakout.

Sept 4 Global Equity Markets report >> blog.techcharts.net/index.php/prem… Image Sept 11 >> Price fails to hold above the upper boundary.

blog.techcharts.net/index.php/2021… Image
Sep 22, 2021 4 tweets 2 min read
Richard Schabacker - Technical Analysis and Stock Market Profits on Gaps... ImageImage 
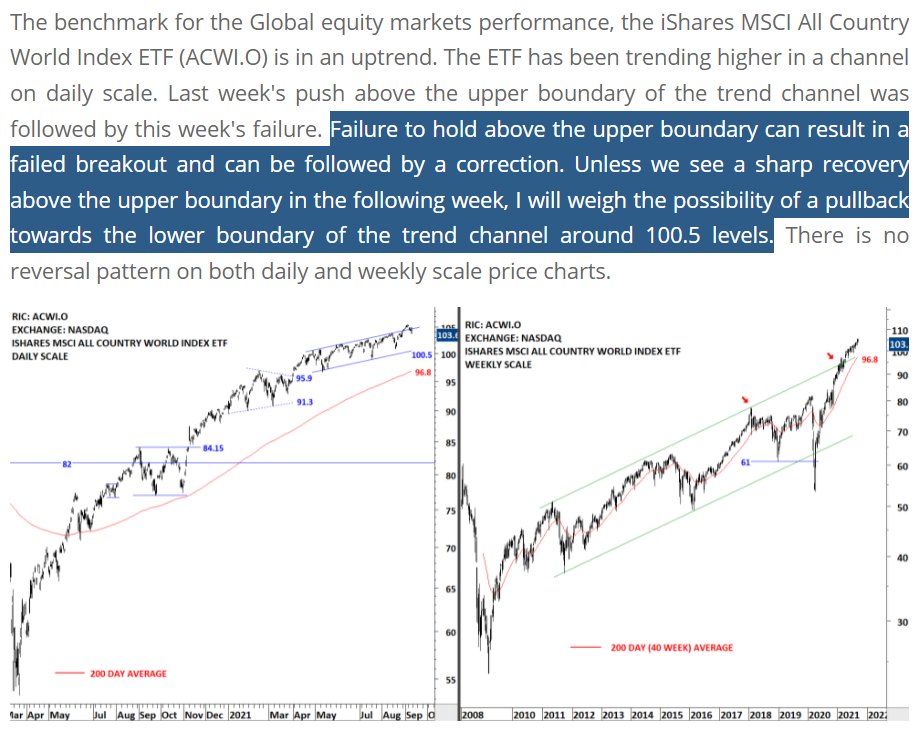
I incorporate breakaway gaps into my analysis as I mainly trade breakouts. Breakaway gaps will appear at the time of breakout through the pattern boundary. Image
Aug 24, 2021 4 tweets 1 min read
If after a breakout your position is holding its gains and not turning negative (no challenge of pattern boundary), chances are high the move will extend way beyond the price objective.

In such cases employ a trend following tool to capture more of the uptrend. Image Few examples below: Image
Aug 11, 2021 6 tweets 4 min read
Waiting for a daily close above the resistance by 3% margin is a trading tactic Edwards & Magee discussed in their book Technical Analysis of Stock Trends.

For some of you this might be a too late entry. Remember that trading tactics can be different for each trader/investor. As there is no perfect stop-loss placement, there is also no perfect entry condition. Sometimes you can miss the breakouts due to gap openings. I'm sure many of you managed to position well into this H&S continuation breakout. Image
Jul 11, 2021 12 tweets 3 min read
I will write a couple of points on #VOLUME. It's a #THREAD. I get a lot of questions regarding volume confirmation on chart patterns. Here is my story with volume as a supporting indicator. I learned #technicalanalysis and charting with the default chart setup of volume at the bottom of each chart. I know how to read volume with price charts.
Jul 9, 2021 4 tweets 1 min read
Trying to pick tops and bottoms in a trend is a low probability event. Identifying an existing trend and trying to capture the trend periods is a high probability event.

First you are going in the direction of the existing trend. There is momentum in your favor.

Second, you have "better" levels of stop placement incase you are wrong.
Jun 7, 2021 4 tweets 2 min read
$BTC One last comment on this: Unless you are quick to reverse position, do not trade the breakdown from the recent #symmetricaltriangle looking consolidation. Given that we are very close to the apex, it will not behave according to text-book. (1) So what should you look for? What is the sweet spot?

I will look for: If breakdown from consolidation, a possible sell-off and a reversal candlestick around 30K. A doji, hammer, bullish engulfing? If I see one of those I will weigh the possibility of a bear trap. (2)