Silver (1/4)
The top portion shows silver/nasdaq ratio.
The middle portion shows the gold/silver ratio.
The bottom portion shows the silver price.
Here we have two ratios, which both appear to be about to breakout higher and lower respectfully. See what happens when they do.
The top portion shows silver/nasdaq ratio.
The middle portion shows the gold/silver ratio.
The bottom portion shows the silver price.
Here we have two ratios, which both appear to be about to breakout higher and lower respectfully. See what happens when they do.

Silver (2/4)
When this happens, it is usually followed by a long rally in the silver price and a rotation into precious metals occurs.
Another ratio which appears to be signalling a bottom in the silver price is Silver/M2 money supply near all time lows.
When this happens, it is usually followed by a long rally in the silver price and a rotation into precious metals occurs.
Another ratio which appears to be signalling a bottom in the silver price is Silver/M2 money supply near all time lows.

Silver (3/4)
The GDX which comprises of gold and silver miners, appears to be trapped in an upward trend channel.
Recently a low has been made at 30 with the upper bound limit of 51 the next target.
#GDX #miners
The GDX which comprises of gold and silver miners, appears to be trapped in an upward trend channel.
Recently a low has been made at 30 with the upper bound limit of 51 the next target.
#GDX #miners

Silver (4/4)
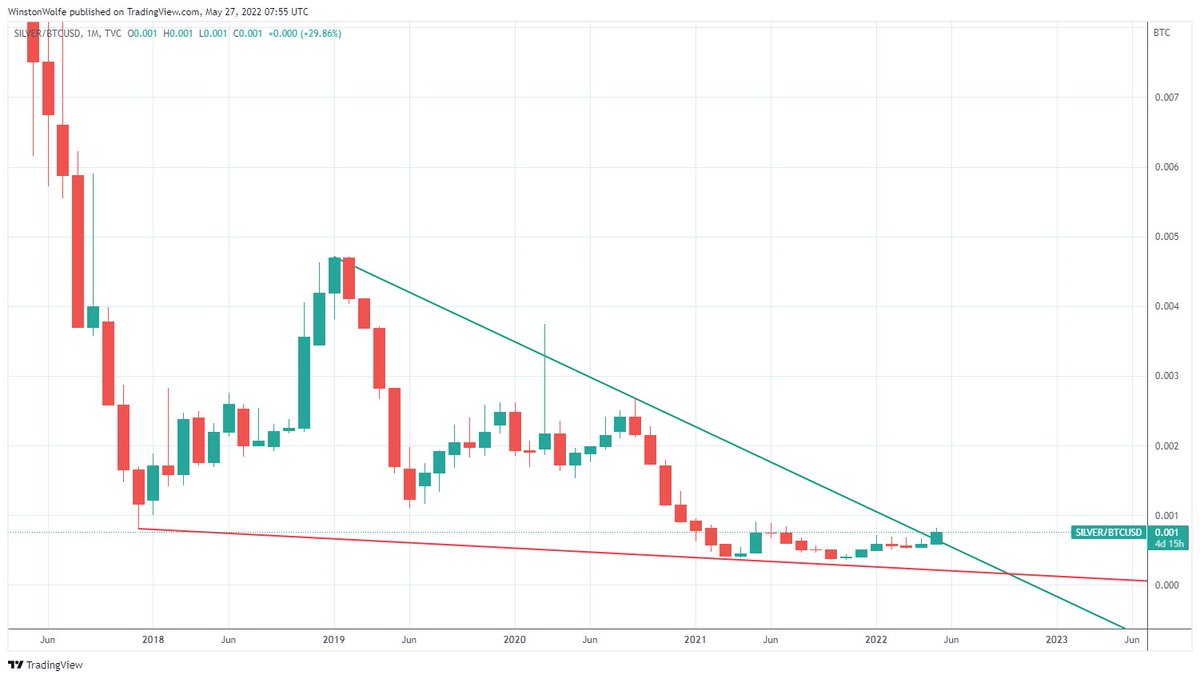
A rotation out of bitcoin, into silver? A lot of money has been chasing crypto the last few years. Maybe this will change going forward with a more balanced approach. The silver/bitcoin ratio appears to be breaking out.
A rotation out of bitcoin, into silver? A lot of money has been chasing crypto the last few years. Maybe this will change going forward with a more balanced approach. The silver/bitcoin ratio appears to be breaking out.

• • •
Missing some Tweet in this thread? You can try to
force a refresh


