1/CSF leaks are controversial Some say they are overdiagnosed, others underdiagnosed. How can you make sure you aren’t under or over diagnosing?
A #tweetorial about a brain MRI score for suspected CSF leaks #medtwitter #FOAMed #radres #neurorad #FOAMrad #csfleak @medtweetorials
A #tweetorial about a brain MRI score for suspected CSF leaks #medtwitter #FOAMed #radres #neurorad #FOAMrad #csfleak @medtweetorials
2/
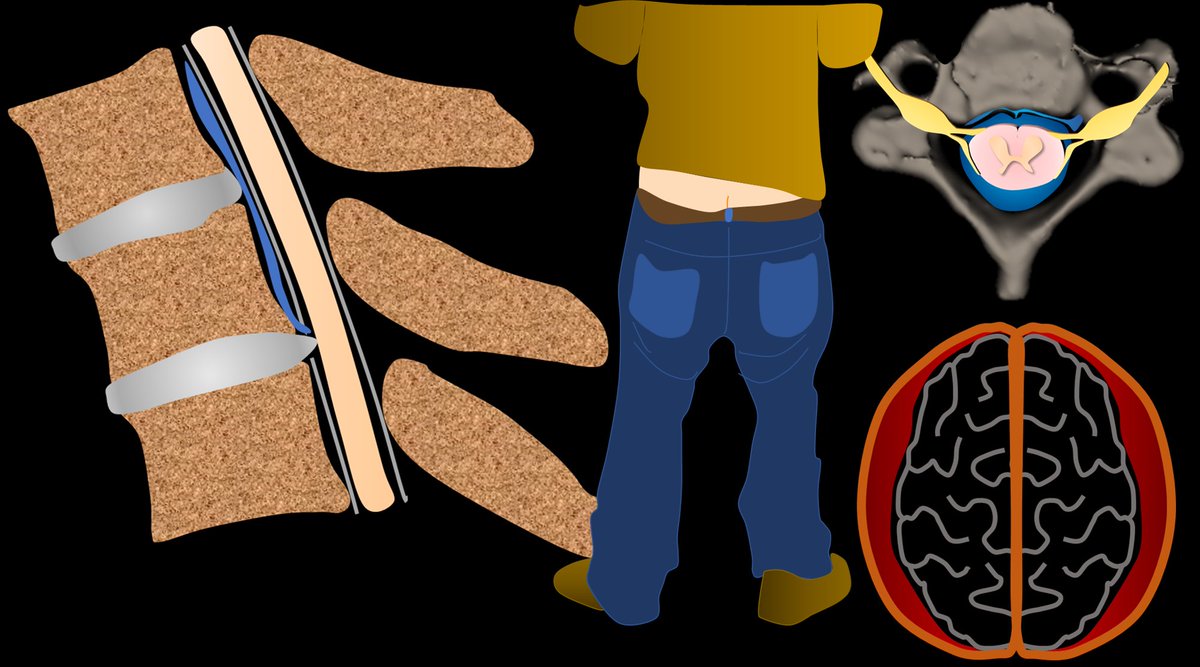
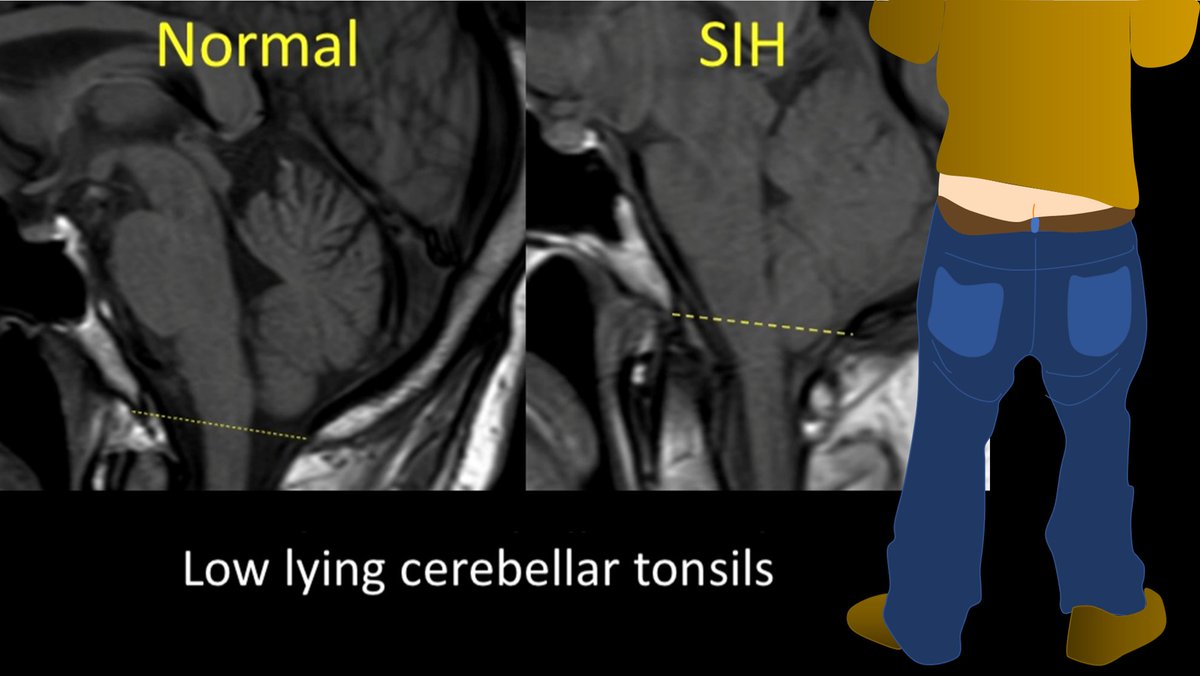
With CSF leaks, everyone knows about brain sagging. But this can happen w/other pathologies, ie Chiari 1. Other findings can be seen on brain MRI in CSF leaks. But what are these findings? Are some findings more suggestive than others? Do more findings = ⬆️suspicion?
With CSF leaks, everyone knows about brain sagging. But this can happen w/other pathologies, ie Chiari 1. Other findings can be seen on brain MRI in CSF leaks. But what are these findings? Are some findings more suggestive than others? Do more findings = ⬆️suspicion?
3/Dobrocky et al. looked at 9 quantitative & 7 qualitative signs seen on brain MRI in CSF leaks to see which are most important. Depending on type & # of findings, they developed a score to indicate what level of suspicion you should have for a leak.
pubmed.ncbi.nlm.nih.gov/30776059/
pubmed.ncbi.nlm.nih.gov/30776059/
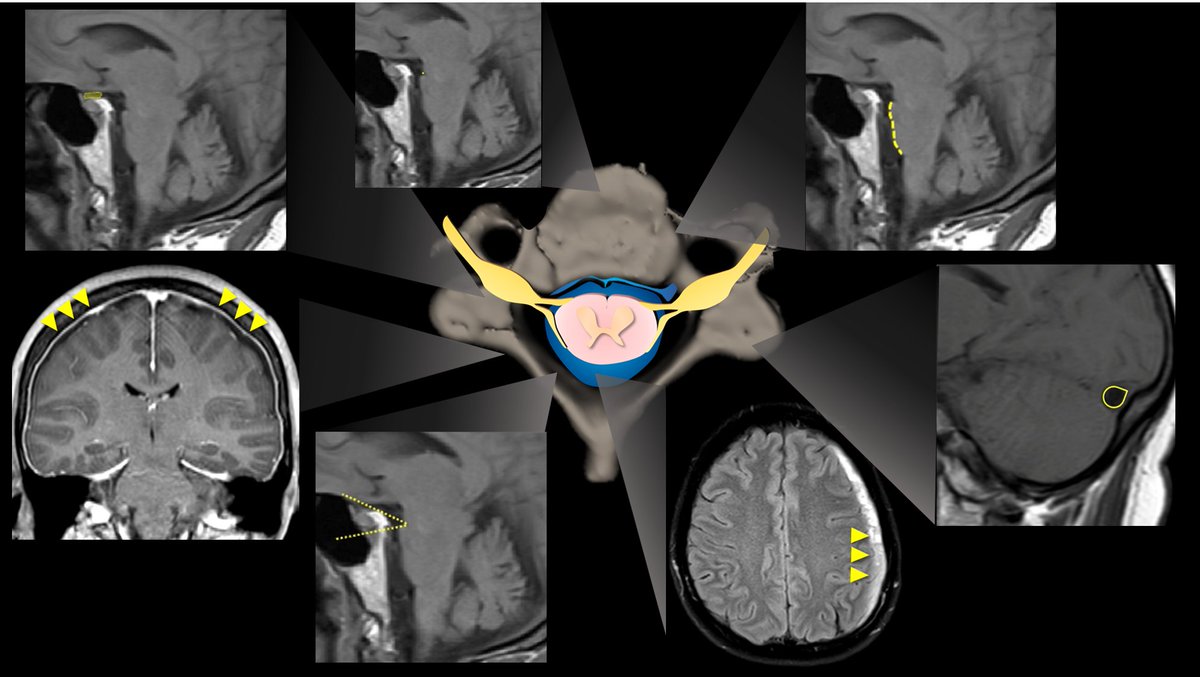
4/Not surprisingly, they found the best sign for CSF leaks is classic pachymeningeal enhancement. While not always seen, it was seen in > 4 out of 5 leak patients, & almost never in others,unless they had recent LP. Therefore, this sign is worth 2 points on the scoring system

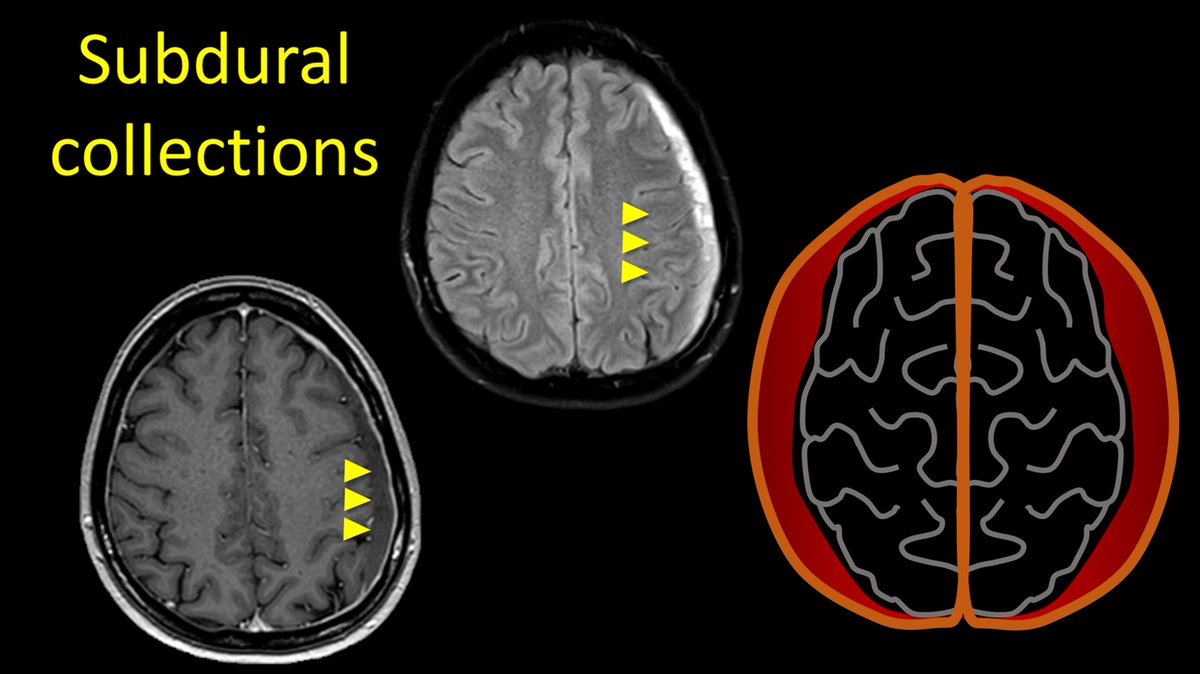
5/Classically, subdural collections are also associated, but these are seen less commonly than pachymeningeal enhancement (~about half of leaks), and other patients may have subdurals for other reasons (ie trauma) and therefore, this is only afforded one point.
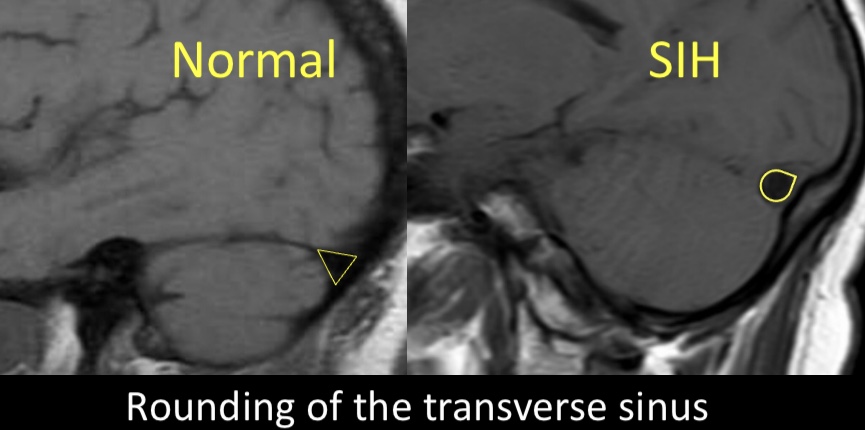
6/A newer finding assoc w/leaks is rounding of the transverse sinus. Dural sinuses enlarge to compensate for loss of intracranial CSF in leak pts, & in doing so, their margins go from concave to convex. This was seen in 2/3rds of leak pts & never in others, so it is given 2 pts
7/Another overlooked finding in leak pts is⬇️in the suprasellar cistern around the chiasm. As the hindbrain sinks, eventually the chiasm sinks w/it & the cistern below it is attenuated. If the suprasellar cistern below the chiasm measures less than 4mm, this is worth 2 points.

8/Decrease in the pre-pontine cistern (<5mm) was not commonly seen, but was more than 4x more common in leak patients and was reproducible among readers of the scans, and so it was given 1 point.

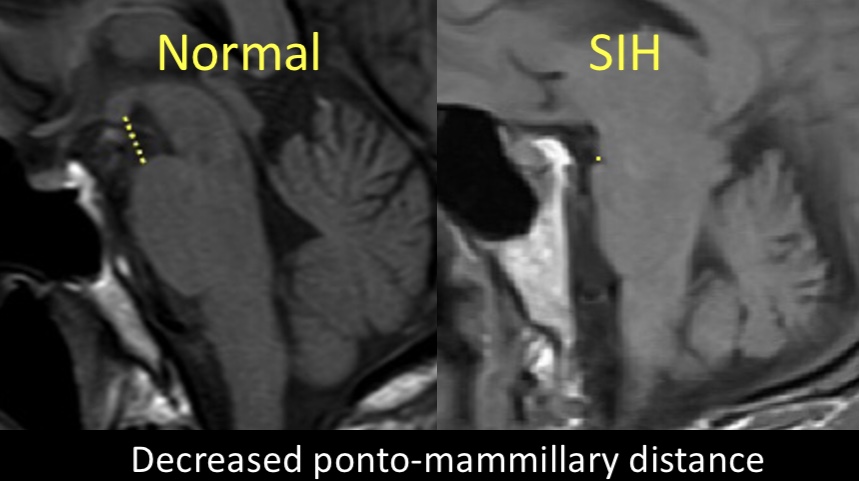
9/Similarly, a decrease in the ponto-mammillary distance (<6.5mm between the mammillary bodies and top of the pons on the sagittal images) was also not commonly seen, but 3x more common in leak patients and therefore worth 1 point.
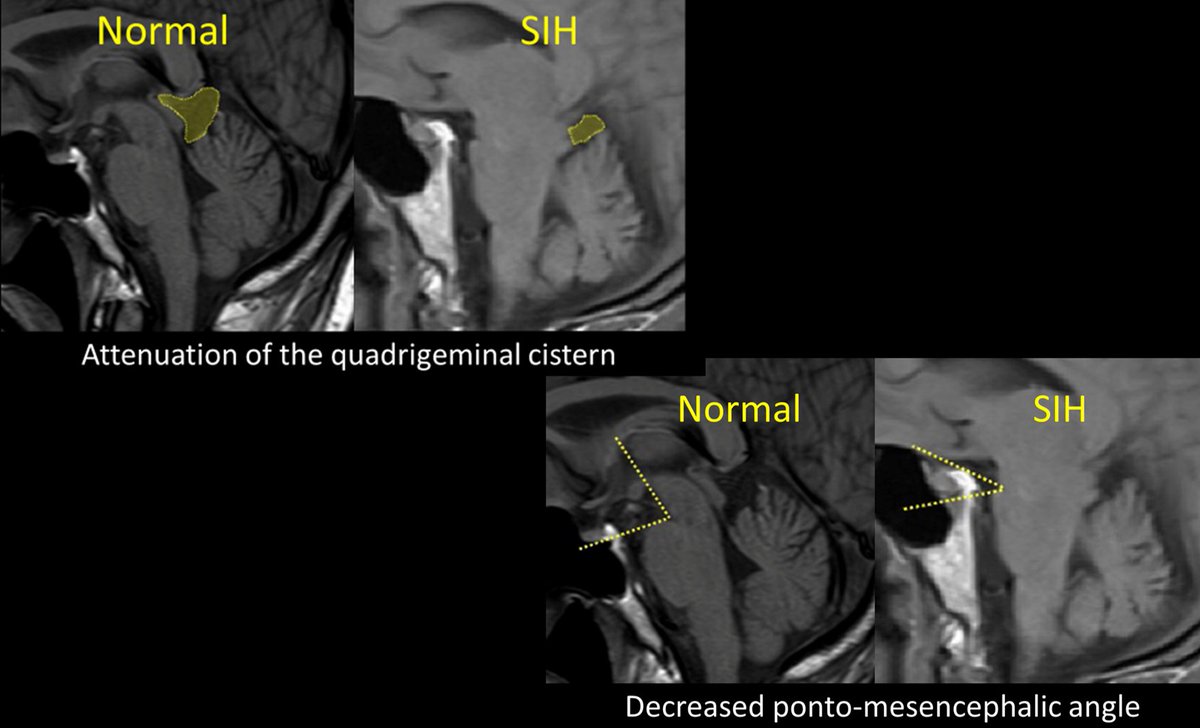
10/Other findings, such as the ponto-mesencephalic angle, attenuation of the quadrigeminal plate cistern, enlargement of the intercavernous sinus, and pituitary contour were not reproducible among readers of the scans and therefore not included in the score.
11/Here is the summary of the points awarded to each finding. The scoring system is classified as follows:
High suspicion >/= 5 points (>90% sensitive & specific)
Intermediate suspicion =3-4 points
Low suspicion </= 2 points
High suspicion >/= 5 points (>90% sensitive & specific)
Intermediate suspicion =3-4 points
Low suspicion </= 2 points

12/ So next time you are looking at a brain MRI for intracranial hypotension, you can feel confident in classifying your suspicion of a CSF leak. Say to them like they say in Billions--you are not uncertain 😉
• • •
Missing some Tweet in this thread? You can try to
force a refresh