I teach a 15-credit course to 3rd yr #datascience ugrads @UCD. I've their full attention for ~10 wks. They work in pairs to produce a major project of their own design. Every year I'm amazed by how they grow during this time & the confidence they gain from what they achieve. 1\n
At the start of the module we've a 1-wk bootcamp where I work on a sample project from start to finish. Each year I pick a new topic & this year it was an analysis of #Wordle, the popular @nytime word puzzle. Here's a summary of the key findings... 2\n towardsdatascience.com/big-data-in-li…
The study was based on an analysis of almost 70M Wordle games: >53M simulated games (using a simulator designed to simulate realistic, not optimal, human gameplay) & >15M real games shared on Twitter. The simulated gameplay matches real gameplay in several important respects. 3\n
We found Wordle popularity peaked, on Twitter, at the start of Feb (~250k unique games posted), and by April postings had fallen to <100k per day. Are we just tired of sharing on Twitter? Google's search stats show just a 25% decline in interest in the same period, so maybe. 4\n
We looked at the ubiquitous "what start word should I use?" question and found plenty of evidence that some start words (eg LEANT, TRACE, CRATE etc.) are much better than others in that they produce shorter games overall. 5\n
The Twitter data suggests that about 17% of players may use poor start words on a regular basis, and as a result they miss out on the opportunity to achieve short games (≤3 guesses). A good start word can mean >3.5x more short games compared to a poor start word. 6\n
Similarly, we looked at the difficulty of target words. Some words are easy to guess (eg WOULD, POINT have lots of short games, few long games & high win-rates) while others are much more challenging (eg JAUNT, SWILL have few short games, lots of long games & low win-rates). 7\n
And while most of Wordle's target words so far have been straightforward to guess (with more short games than long game) some have been especially challenging (e.g. PROXY, SWILL, LOWLY, FEWER). Why is this? 8\n
One reason is that the difficult words are less common and have unusual combinations of letters, but also because they have duplicate letters. Wordle's hints don't really help us much when it comes to repeating letters. 9\n
If you want to succeed at Wordle then you need to pay attention to all of the hints provided as feedback & consider carefully how they constrain your future guesses. Basically, if you ignore the hints then the number of rounds needed to guess a target word increases quickly. 10\n
We can estimate how important different hints/constraints are, based on how much new info they provide per guess. We analysed >250M rounds of play and found the information gained from the yellow hints to be the most important, then green, then grey. 11/n
Query for immunologists...we need about 70% of the pop. to be vaccinated for herd immunity; ie. at 70% we get R=1. So lets call it 3.5m vaccinations. Can we do 500k/month? So this takes 7 months to achieve? What’s the effect of increasing vaccination levels by 500k/mth on R? 1/
In Jan we will be facing the prospect of a further lockdown as cases will be rising fast. If we start vaccinations in Jan then how will this help the R number. If 70% vaccinations imply R~1, then is there a linear relationship between vaccination level and R? 2\
Eg. in early Oct the national R number was about 1.2. If this is our baseline “being careful” rate, and if 10% of the population get vaccinated then does this reduce this baseline rate? By 10% ish? If so will R fall by 10%/mth due to vaccinations, all other things being equal. 3\
Some people have been asking about the ‘models’ I used in this graph to make case predictions beyond today. It’s very simple. There isn’t a model, at least not in the complicated way you might think. Wtf?!? Let me explain.
1\
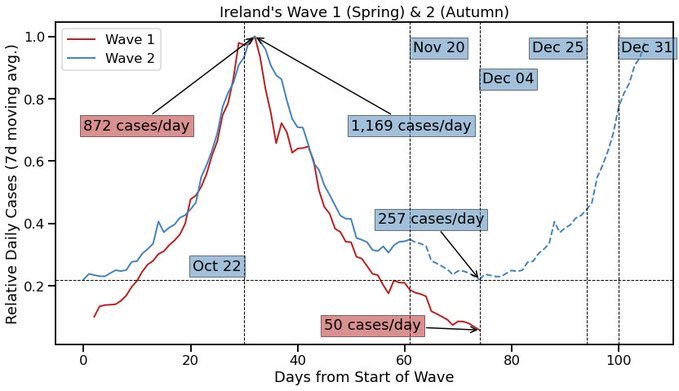
Instead of using a complex predictive model & having a debate about parameters etc. I just used the case trend/numbers from waves 1 (red) & 2 (blue) after aligning the relative case numbers based on their peaks, as shown. Both waves are similar so this makes sense. 2\
Next, I ‘predict’ the remaining cases in (wave 2) L5 by assuming the trend will match that during the same period in wave 1 (ie the red line between Nov 20 - Dec 4, since I aligned wave 1 from March-June with wave 2 today). This gives the dashed blue line from Nov 20 to Dec 4. 3\
Level 5 seems well & truly stuck now, & each day brings a new even higher cases/day ‘prediction’ for an early Dec exit; its now 257 today, up from 223 yesterday. The problem is not only that cases are stalled/rising, but we have less and less time left to fix it before Xmas. 1/
That puts us >500c/d by Dec 25 & >900c/d by Dec 31, but that’s if transmission in Dec is similar to tx in Sept/Oct, which is surely very unlikely. Chances are, it will be markedly worse because of Xmas, so we’ll get more cases later in Dec & need a lockdown in early Jan. 2\
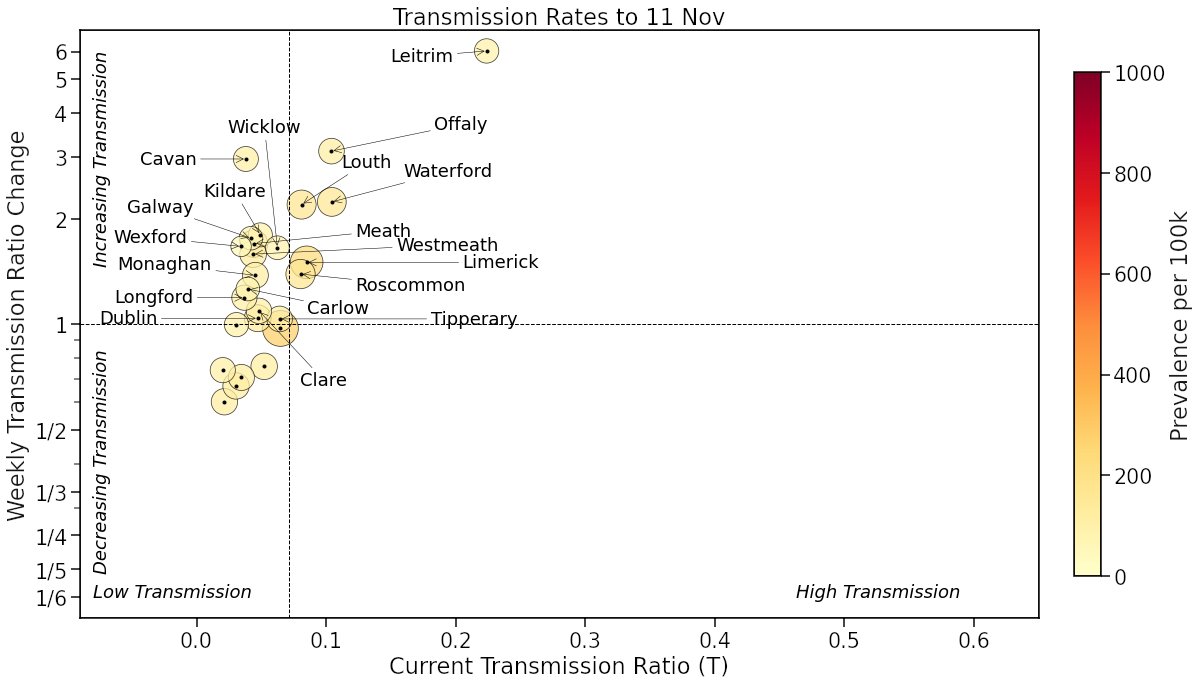
There are 19 counties on the naughty-list tonight (increasing transmission rates, week on week), up from 16 yesterday, including Dublin, and 6 of them now in the upper-right quadrant (high transmission & rising) which likely means further case increases in the coming days.
How are things going in Level 5? Cases and positivity rates are coming down nicely. How does this compare to wave 1 and can this help us to predict where we might get to by December? Let’s have a look ...
(1/n)
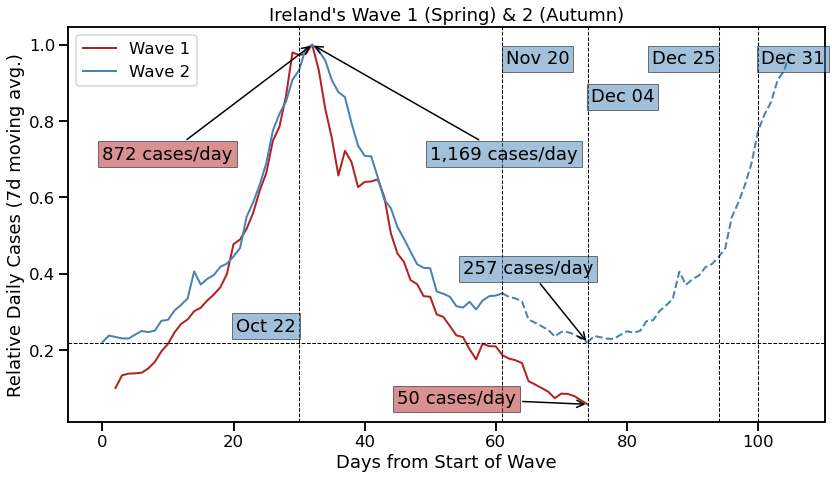
I’ve aligned waves 1 & 2 using their peaks. The y-axis is the 7d moving average of daily cases as a fraction of each wave’s peak. Wave 1 peaked at ~872 c/d and came down to about 50 c/d by June. So far, wave 2 has peaked at 1169 c/d & its falling. Where will it fall to?
(2/n)
Next, I (naively) extend wave 2 using the corresponding portion of wave 1; very simple yes, but probably a reasonable, if optimistic, estimate that saves on the modelling.
It suggests that we will get to about 144 cases/day on Dec 4.
(3/n)
Slovakia's drive to test its entire population over 2 weekends got off to a good start on Saturday with 2.5m tested and 1% positivity. Those 25k positives are now in quarantine. A voluntary programme with opt-outs required to quarantine for 10 days.
(1/n) theguardian.com/world/2020/nov…
Next weekend the second half will be completed and presumably another ~25k positive cases will be found. So approx. 50k people will be in quarantine for 10-14 days. The remaining >5.4m people will presumably be free to go about their business with limited restrictions. (2/n)
There will be false positives among the 50k positives, possibly a fair few of them, but the alternative is that everyone goes into lockdown so this seems like a reasonable trade-off. There will also be false negatives circulating but there shouldn't be too many of them. (3/n)
This seems like an interesting experiment. Slovakia is testing entire population (5m) over 2 w/ends. Testing is ‘voluntary’ but those not participating must self-isolate for 10d. The first round covered 1m people with 1% positivity.
(1/n) @dwnews
In theory, absent issues with false negatives, could an approach like this drive the virus out of a country within a couple of weeks after testing? Imperfect because of false negatives and secondary tx during isolation, but it would surely do more than 6 was in L5 (for all) (2/n)
Eg, assume 1% positive rate from round 1 is correct, then Slovakia will end up with 50k people in isolation for 10-14days after a full testing cycle. After that cases will be the false negatives & secondary tx during isolation. (3/n)