Thread: 5 Important bullish & bearish chart patterns in technical analysis.
Triangles, Broadenings and Rectangles.
#trading #investing
Triangles, Broadenings and Rectangles.
#trading #investing
Many traders analyse and practice western chart patterns. There are many such patterns and enough is talked about them in various books and resources.
Long back, I read a book “Encyclopedia of Chart Patterns” by Thomas N. Bukowski. It’s a brilliant work (Must read).
Long back, I read a book “Encyclopedia of Chart Patterns” by Thomas N. Bukowski. It’s a brilliant work (Must read).
He backtested many patterns & ranked them based on their performance. Most imp is that he separated the patterns based on their performance in uptrend & downtrend.
I read about those patterns at many other places & in different theories and I realised that most of them are-
I read about those patterns at many other places & in different theories and I realised that most of them are-
-variations of broad category of patterns. I have bifurcated these patterns in various categories.
Triangles, Broadenings & Brackets or Rectangle patterns are most common & effective patterns. Below are 5 bullish & bearish proven, time-tested patterns of these categories.
Triangles, Broadenings & Brackets or Rectangle patterns are most common & effective patterns. Below are 5 bullish & bearish proven, time-tested patterns of these categories.
Bullish Patterns:
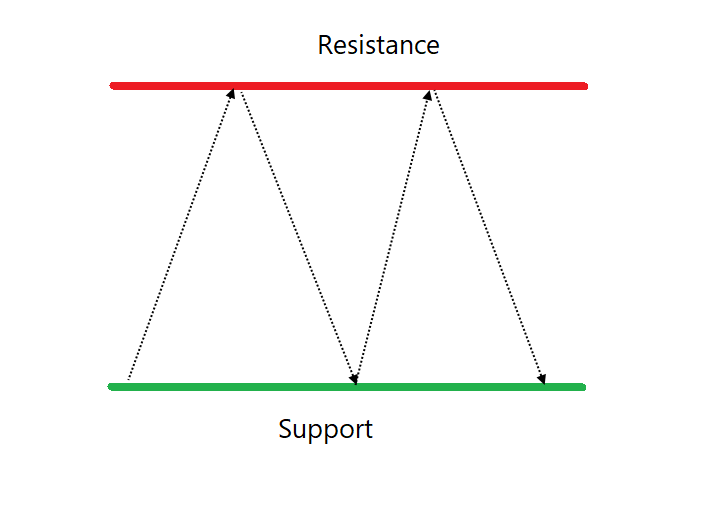
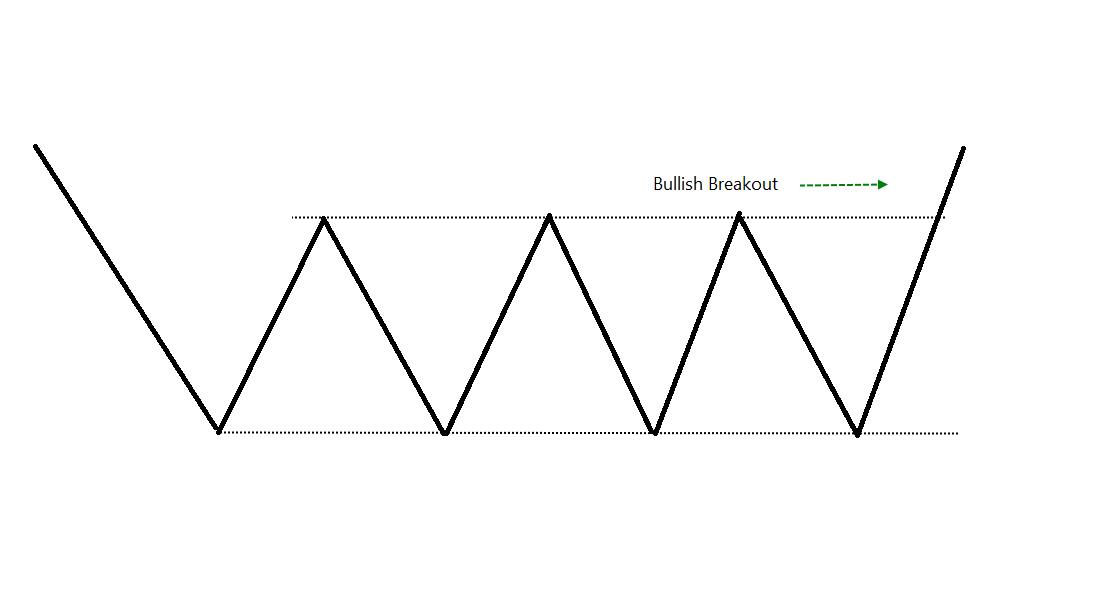
Rectangle Breakout:
Horizontal pattern breakout. Price remains between two horizontal lines before upward brkout. Its a decent continuation breakout pattern when appears in uptrend. Reversal pattern when appear in downtrend (Decent Risk-reward). Tend to pullback
Rectangle Breakout:
Horizontal pattern breakout. Price remains between two horizontal lines before upward brkout. Its a decent continuation breakout pattern when appears in uptrend. Reversal pattern when appear in downtrend (Decent Risk-reward). Tend to pullback
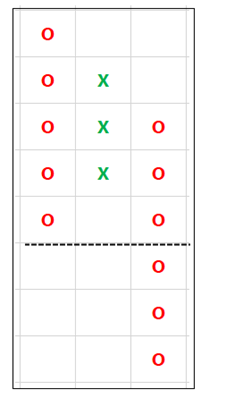
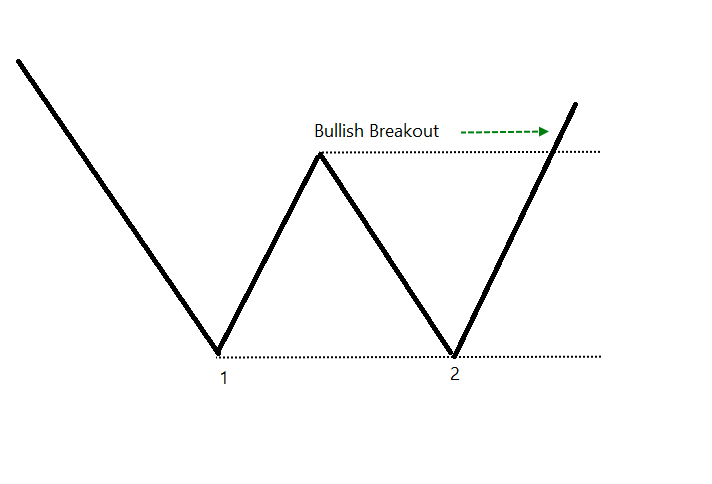
Double Bottom:
Two-bottoms around same level followed by the breakout. Good reversal patterns when they appear in downtrend. If you don’t wait for the breakout, the failure rate is significantly high. Many call it double bottom even before the breakout, they must know it.
Two-bottoms around same level followed by the breakout. Good reversal patterns when they appear in downtrend. If you don’t wait for the breakout, the failure rate is significantly high. Many call it double bottom even before the breakout, they must know it.
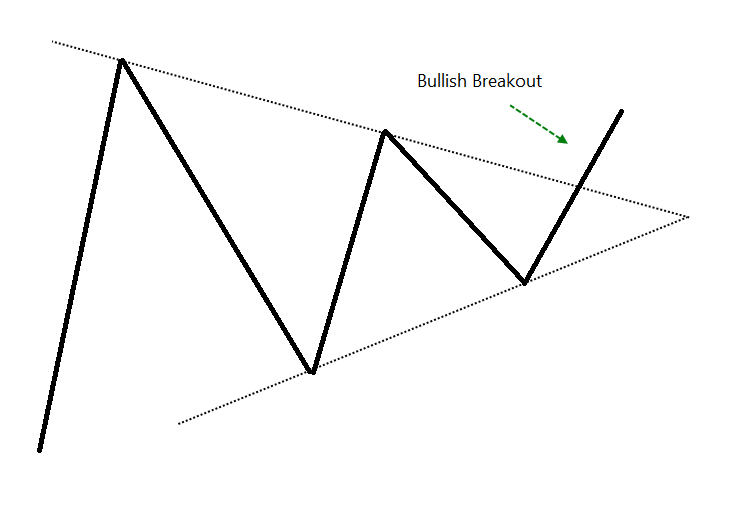
Symmetrical triangle - bullish
Pattern of convergence followed by upside breakout. Nice continuation pattern if appears in uptrend. Bullish triangles breakouts have got better performance. High volume at breakout would be nice.
Pattern of convergence followed by upside breakout. Nice continuation pattern if appears in uptrend. Bullish triangles breakouts have got better performance. High volume at breakout would be nice.
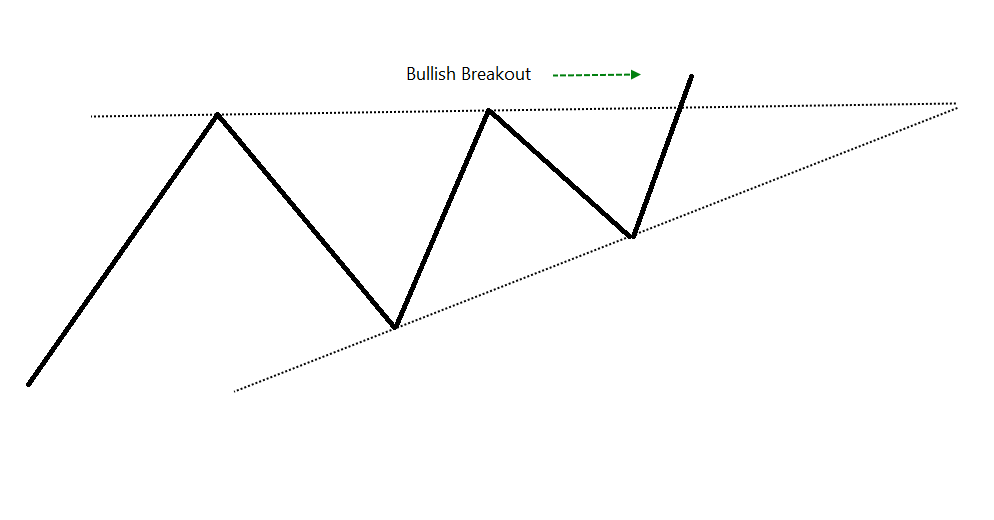
Ascending Triangle:
The top is horizontal in the triangle and the bottoms are upsloping. Ascending triangles are bullish in nature. Resistance at top but bottoms are rising. Bullish breakouts have better ratio. The reward to risk ratio in triangle patterns is high.
The top is horizontal in the triangle and the bottoms are upsloping. Ascending triangles are bullish in nature. Resistance at top but bottoms are rising. Bullish breakouts have better ratio. The reward to risk ratio in triangle patterns is high.
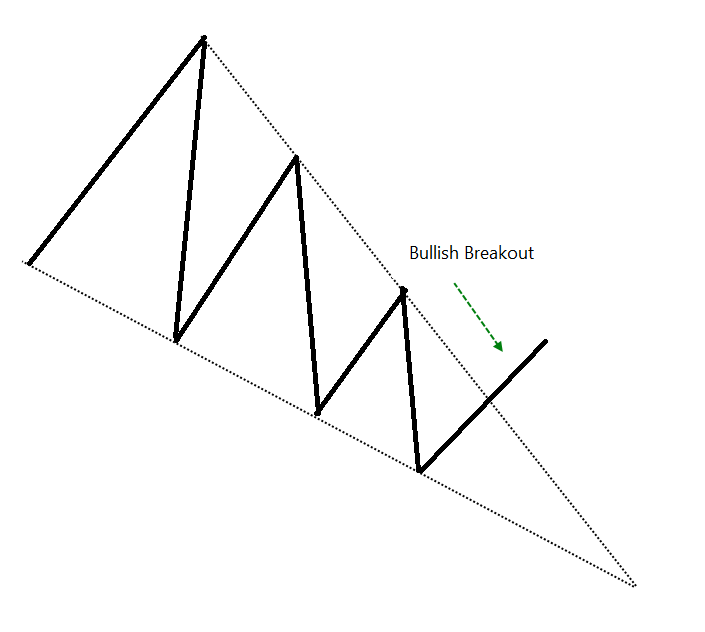
Falling Wedge:
Price remains within the down slopping and converging trendlines followed by upside breakout. I also call it falling triangle. It is a decent bullish trend reversal pattern.
Price remains within the down slopping and converging trendlines followed by upside breakout. I also call it falling triangle. It is a decent bullish trend reversal pattern.
Bearish Patterns:
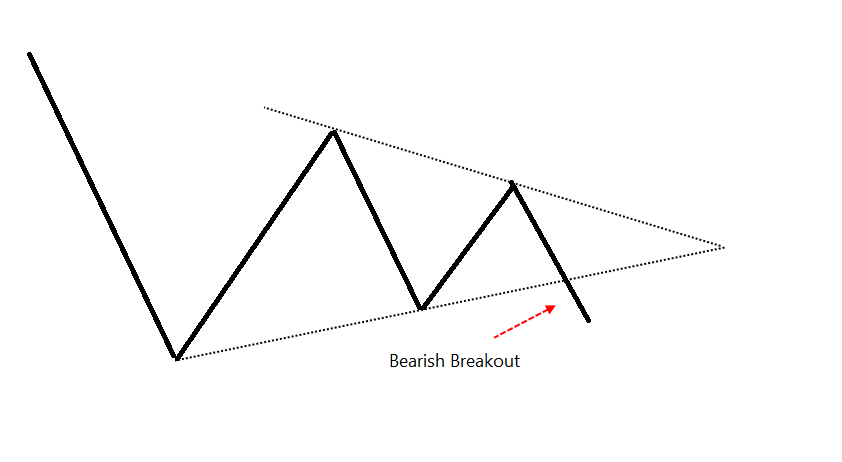
Symmetrical triangle - bearish
Symmetrical triangle appears in the downtrend followed by the bearish breakout. It is a bearish continuation pattern having high risk-reward ratio.
Symmetrical triangle - bearish
Symmetrical triangle appears in the downtrend followed by the bearish breakout. It is a bearish continuation pattern having high risk-reward ratio.
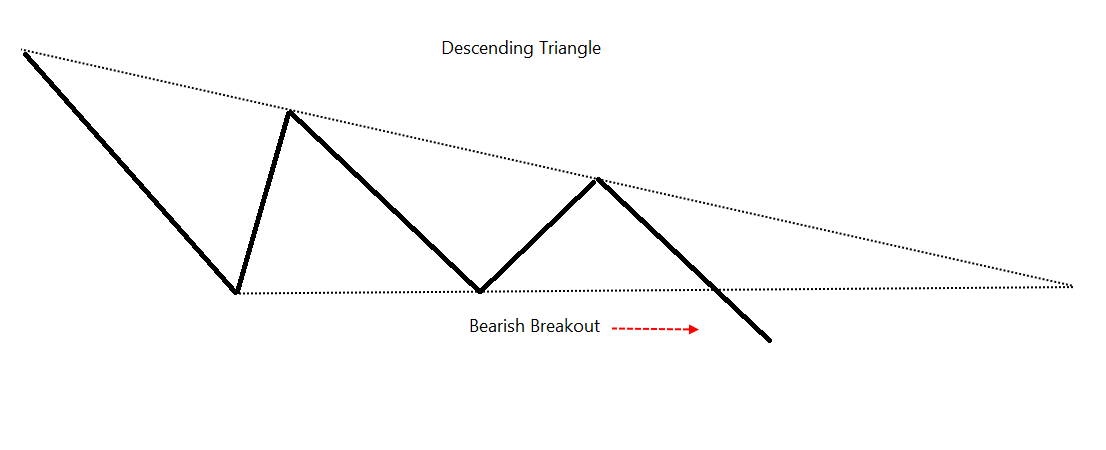
Descending Triangle:
Top is descending and bottom is horizontal in the triangle pattern. Descending tops indicate supply and horizontal bottom is a strong support. The pattern is bearish in nature and downside breakout is a decent trade setup.
Top is descending and bottom is horizontal in the triangle pattern. Descending tops indicate supply and horizontal bottom is a strong support. The pattern is bearish in nature and downside breakout is a decent trade setup.
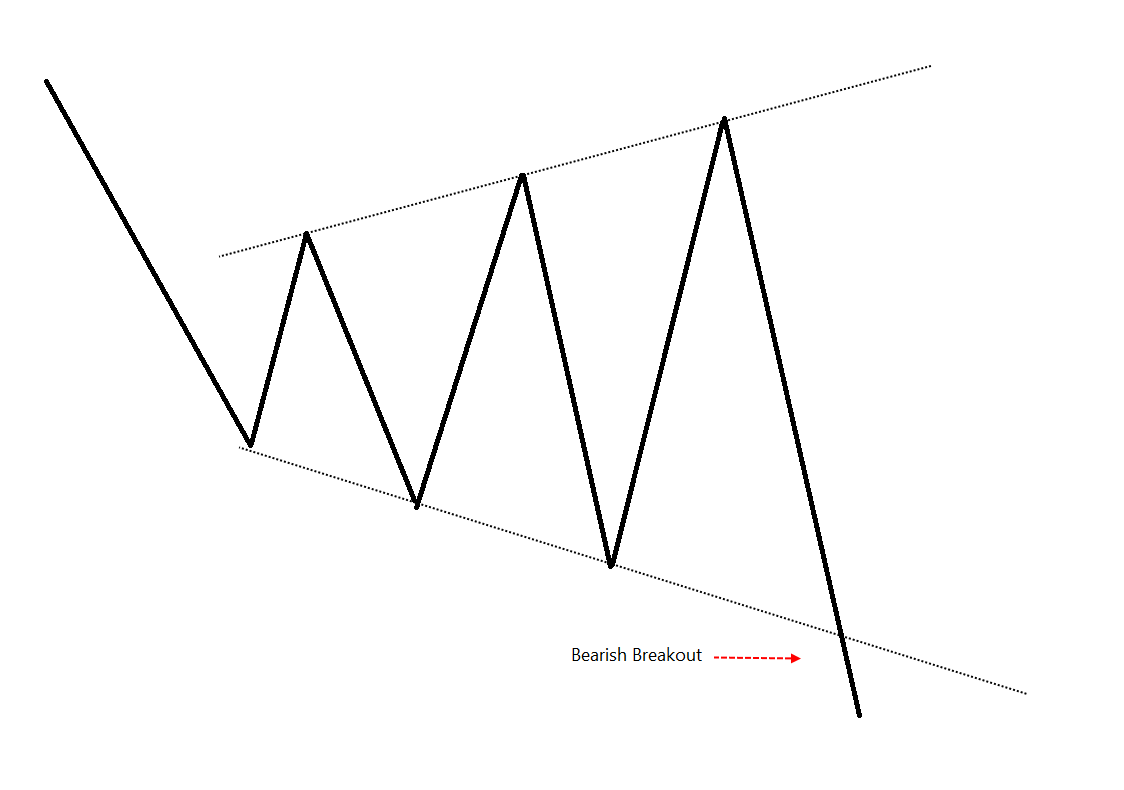
Broadening pattern:
Also known as Megaphone or Expanding triangle. When it appears in downtrend, its more of a continuation pattern (downside breakouts are better) than reversal. When it appears in uptrend, downside breakout would be a better setup.
Also known as Megaphone or Expanding triangle. When it appears in downtrend, its more of a continuation pattern (downside breakouts are better) than reversal. When it appears in uptrend, downside breakout would be a better setup.
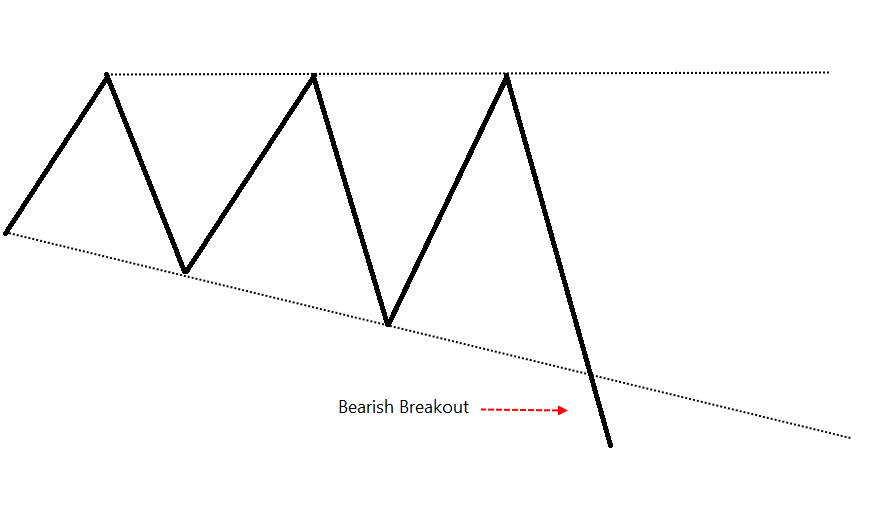
Broadening - Descending:
The top is horizontal in the broadening pattern. The lows are following the down slopping trendline. New lows are being made and there is a strong resistance at top. Downside breakout would be a bearish setup.
The top is horizontal in the broadening pattern. The lows are following the down slopping trendline. New lows are being made and there is a strong resistance at top. Downside breakout would be a bearish setup.
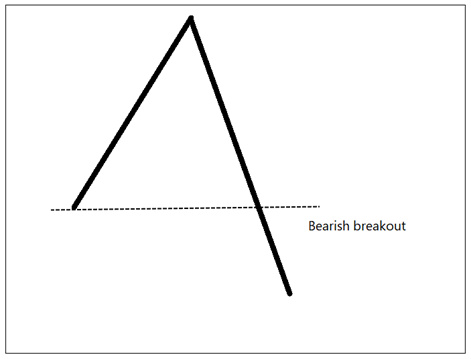
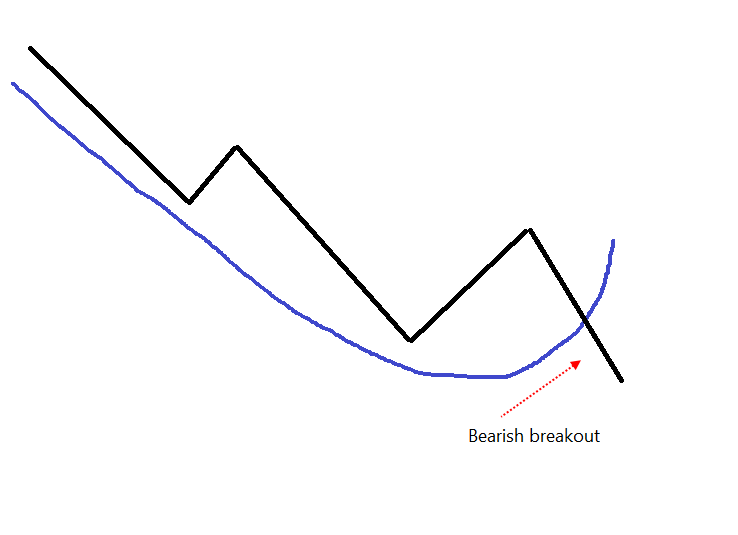
Scallops, Descending
The pattern that looks like letter J reversed. It is a bearish continuation pattern. The trend is down and established. The bearish trades are expected to have a better risk-reward.
The pattern that looks like letter J reversed. It is a bearish continuation pattern. The trend is down and established. The bearish trades are expected to have a better risk-reward.
The performance of patterns may vary based on nature of instrument & the mkt phase. These are v well-known & useful patterns for price action traders.
They are also the useful concepts which can be used in many ways.
They are also the useful concepts which can be used in many ways.
Eg. Oscillators r more useful in sideways mkt. Channel indicator squeeze is a pattern of convergence & so on.
Patterns can be used along with tools like indicators, retracements etc.
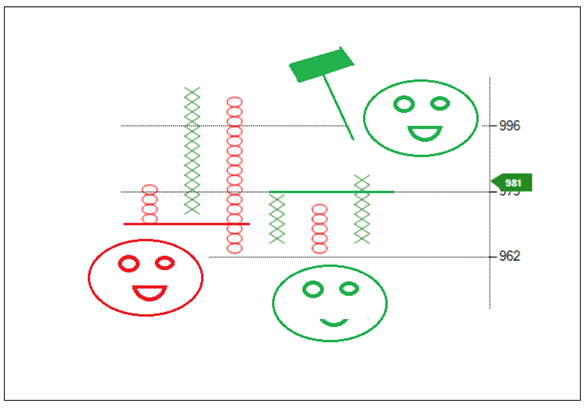
I read them on P&F, Renko and Line-break charts and try to bring some objectivity. <End>
Patterns can be used along with tools like indicators, retracements etc.
I read them on P&F, Renko and Line-break charts and try to bring some objectivity. <End>
• • •
Missing some Tweet in this thread? You can try to
force a refresh