
Our paper "Covid-19 and herding in global equity markets" (with @GersonJunior__) is now published in the Journal of Behavioral and Experimental Finance and freely available for 30 days using the link below.
#herding #finance #IESEGResearch #COVID19
authors.elsevier.com/a/1fFGk7tZBboo…
#herding #finance #IESEGResearch #COVID19
authors.elsevier.com/a/1fFGk7tZBboo…

In the paper, we investigate the presence of herding in 10 equity markets, with a particular focus on analyzing the Covid-19 period and comparing it with previous crisis period such as the 2007-2008 GFC.
The countries in the study (Australia, Belgium, Brazil, China, France, Italy, Japan, Sweden, the UK, and the US) were chosen because they show a remarkable diversity in terms of governments’ responses to pandemic as well as its impact and the timing of Covid-19 waves.

To analyze all countries consistently, we construct market indices using Compustat data. We follow "MSCI-style" rules to define a suitable universe of reasonably tradable stocks. Our constructed indices are very similar to their MSCI counterparts.
The vast majority of herding studies relies on regression models using a measure of cross-sectional dispersion in returns. For example, in the widely used Chang et al (2000) model, first the cross-sectional absolute deviation (CSAD) of returns is calculated:

Then, the CSAD is regressed on the absolute and square values of the market return:

The rationale behind these methods is that, when investors mimic the actions of others, individual stock returns become less dispersed around the market return than what rational asset pricing models suggest.
Under the CAPM, the expected CSAD has a linear relationship on the abs value of the market return. A negative γ₂ in the regression indicates the presence of herding. Chang et al use the realized CSAD as a proxy (since ECSAD is unobservable).
Although widely used, this methodology presents some difficulties.
• First, it does not include any mechanism to control for changes in fundamentals. It may be that investors trade in the same direction because they are reacting to the same observed changes in fundamentals
• First, it does not include any mechanism to control for changes in fundamentals. It may be that investors trade in the same direction because they are reacting to the same observed changes in fundamentals
• Second, these are mostly static methods: they only give a binary indication of whether herding was present in the sample
• Third, the Chang et al (2000) model is, in general, biased against finding evidence of herding (Bohl et al., 2017; Stavroyiannis and Babalos, 2017).
• Third, the Chang et al (2000) model is, in general, biased against finding evidence of herding (Bohl et al., 2017; Stavroyiannis and Babalos, 2017).
Many studies rely on different strategies to address these issues and improve the model. Instead, we use a different model, proposed by Hwang and Salmon (2004), which is based on a state-space approach. In this model, betas are assumed to be biased (relative to the CAPM):

In this model, hmt ≤ 1 is a latent time-varying herding parameter that determines the degree of herding. If hmt = 1, there is perfect herding towards the market portfolio (all individual assets move in the same direction and with the same magnitude as the market portfolio).
If hmt = 0, there is no herding (and no bias in betas). The model itself is based on analyzing the cross-sectional standard deviation of betas, which ends up depending on a transformation of hmt, which can be analyzed in a state-space model.

The cool thing about this model is that the researcher can add control variables to account for the effect of fundamental variables. We use a specification that includes the market return, market volatility, the Economic Policy Uncertainty index, and a measure of illiquidity.

This allows the researcher to disentangle the effects of herding due to fundamentals (ie "spurious herding") from pure herding (hmt).
After estimating the state-space model, we can obtain smoothed estimates of the herding parameter. This allows us to observe the dynamics of herding over time. The graph below shows in green the periods of significant herding, and in red the periods of anti-herding:

We can see that both herding and anti-herding are present to some degree in all countries. We find that periods of market stress are usually more associated with anti-herding rather than herding, whereas calm periods are more associated with herding.
This suggests that, when markets are calm and doing well, investors are more likely to imitate each other; however, during periods of increased market uncertainty/stress, investors may not all agree on the impact of observed fundamentals and trade differently.
Next, we zoom in on two periods of crisis: the 2007-2008 GFC, and the Covid-19 crisis. We find much more commonality during the GFC, with most countries showing a degree of herding before the GFC, and going into adverse herding once the crisis become more evident.

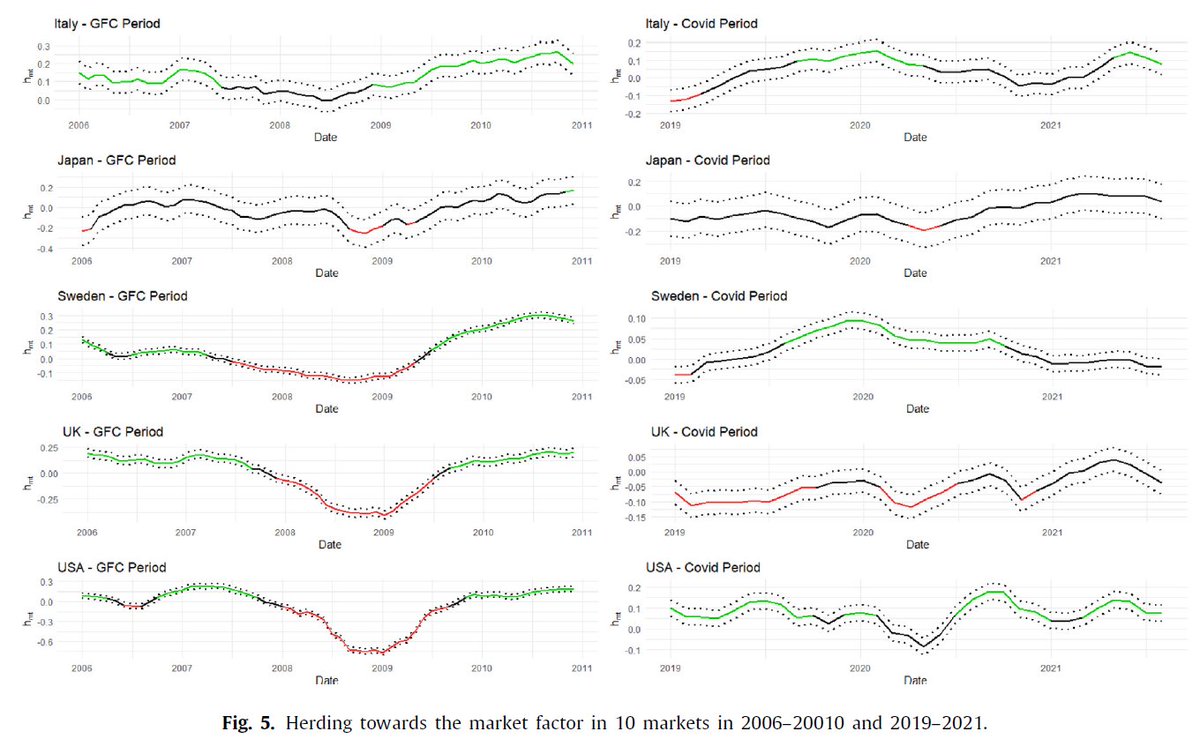
During the initial states of the Covid-19 crisis (first half of 2020), when market volatility was at its highest, the only countries where herding appears more strongly are Italy, Sweden, and the U.S. So, overall, we find very little evidence of herding during the pandemic.
Lastly, using a panel regression approach, to investigate whether herding patterns can be explained by differences in the severity of the pandemic in each country, as well as the governmental measures implemented in response to the pandemic, which have been heterogeneous.
The results suggest that a government response stringency index, which measures the degree to which ‘‘lock-down style’’ governmental actions restricting mobility were implemented, was associated with decreases in herding.
On the other hand, measures that provide economic support tend to increase the level of herding.
These results suggest that governments' actions during a crisis may impact herding in financial markets (in either direction). An anecdotal example of this was the frothiness in U.S. markets associated with the stimulus checks, which caused many investors to chase similar stocks.
End of thread!
• • •
Missing some Tweet in this thread? You can try to
force a refresh


