Like every year, with @space_angelC we are updating the Eurospace #spaceeconomy data set with the compilation of 2021 launch events. I will post a few charts making this thread grow as I get them ready. So let's get started. 1/n #eurospacefacts
First the global situation. A few charts to look at the main trends in space activity from the supplier perspective, and in mass at launch. 2/
Here is the total mass launched by spacecraft production region. We clearly see that #Starlink (230t in 2020 and 260t in 2021) is disrupting launch mass statistics. We can also see the major growth of Chinese space activities. All of it is institutional. #eurospacefacts 3/
We can have a look at the same chart but without the impact of human related programmes (ISS/Tiangong). The mass impact of Starlink (and of Chinese programmes) is even more striking. #eurospacefacts 4/
And now we can put in perspective the impact of privately funded spacecraft vs institutional programmes, and here again the current impact of Starlink on launched mass statistics is absolutely unique. #eurospacefacts 5/
We see that the average mass of satellites is decreasing a lot in recent years, with the average satellite weighing less than 400 kg in 2021, against 2,7t in 2012. This trend is very much driven by Starlink (avg w/o Starlink: 600kg), but not exclusively. #eurospacefacts 6/
Let's have a look at institutional activity and notice how China has really stepped up its game. In 2021, the Chinese space programme launched to orbit as much mass as all the other institutional programmes worldwide combined. #eurospacefacts 7/
When considering the military component of institutional space activity the data shows a general trend towards more military space activity, and a clear ambition for China to bridge the gap with the USA and Russia. Europe has no such ambition obviously. #eurospacefacts 8/
Coming next: our estimates for spacecraft and launch service market values in constant M$ using purchasing power parities for accurate international comparisons. 9/
• • •
Missing some Tweet in this thread? You can try to
force a refresh
With @NedhirSahli we are regularly updating our launch events database, and today we had a closer look at the Falcon 9 Transporter missions. Let's share our findings in a little thread. #spacex #falcon9 #transporter
1/
When the Transporter missions were first proposed by SpaceX I was intrigued by the pricing system, and I was wondering whether the missions were able to yield a profit at all. My original 2021 post is here. 2/
Now that there have been 12 Transporter missions already, what are the stats?
First we note that the total mass deployed is not really improving, and, with the exception of T-1, is usually well below 3 tons/launch. A very small load for Falcon 9. Is it a demand problem? 3/
“Northrop was uncertain that the commercial market existed beyond guaranteed contracts to house NASA astronauts, and this is likely what led to its decision to drop a bid.”
I share this view. 1/
Moreover I believe that all these NASA “newspace” type of procurement contracts (COTS/CRS, CLD, CLPS…) will be a major disappointment for suppliers in the long run. 2/
Rather than creating a healthy new business environment for space system suppliers, they will hardly create a profitable market and will eventually drive vendors under water. 3/
Interested in some @RocketLab #Electron launch data?
I've been compiling the last 3,5 available years of data from the 10-Q and 10-K reports, and have found a few intersting facts.
TL/DR:
- average unit price >6,1M$
- average mass launched: <90kg
- average price/kg: <70k$
1/
First, the general trend for Electron price is increasing.
See here the average unit price per launch per year.
Note that 2023, includes HASTE, a suborbital launch. 2/
The trend for price/kg seems to stabilise, at the very high value of >70k$/kg. Even considering the notion that Electron offers a bespoke service of high value, the cost/kg for customers is very high. Must be hard to close a business case with this (Note: 2023 excludes HASTE). 3/
I have this bad habit of looking into financial statements of space companies. Today I found it interesting to compare side by side the financial statements of @RocketLab USA and its NZ subsidiary.
1/
The NZ subsidiary of RL provides exclusive services and products to its USA parent. While goods are sold 'at cost', for services the NZ sub applies a 'margin to cost of 5 to 10%'. 2/
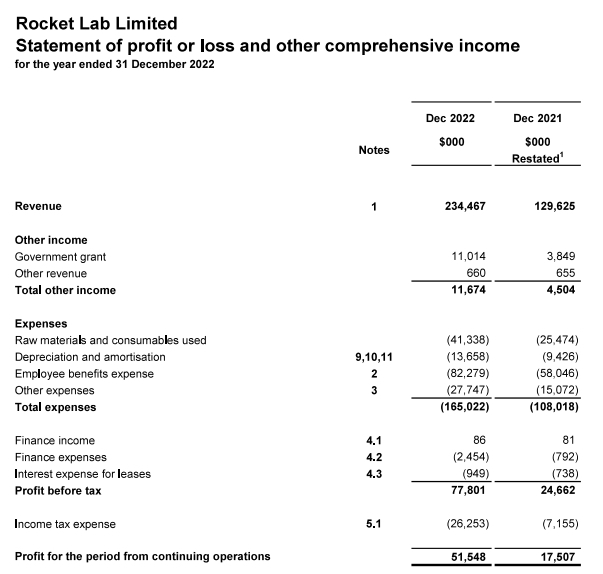
As a result, the NZ subsidiary cannot lose money, since all it does is work for RL USA with a guaranteed coverage of costs. At the end of 2022 it even made a profit before tax worth 77 MNZD (50M$), and 24 MNZD in 2021. 3/
Let's do some simple math to compare broadband satellute systems then. The main metrics will be capacity/kg in orbit. I will also consider the useful satellite life expectancy to be complete. 1/
Assumptions on Starlink useful capacity are many. There seems to be consensus between 15 and 20 Gbps/satellite (V1). This would equate to up to 0,08 Gbps/kg/year (assuming 250kg) and 0,4 Gbps/kg over 5 years of usage. 2/
Now lets' compare to recent broadband satellites launched in GEO. Eutelsat Konnect VHTS claims 500Gbps for 6,4 tons. That's 0,078 Gpbs/kg, like Starlink, or 1,17 Gbps/kg over 15 years of usage. 3/ thalesgroup.com/en/worldwide/s…
So we have a new space SPAC breeding. Last year I worked with a master student on a toolbox to analyse the SPAC thesis. Let's see how Intuitive Machines performs on our indicators. 👉This is NOT investment advice. 1/
First the source: the analyst day presentation is here: intuitivemachines.com/_files/ugd/7c2…
There is one first red flag. The complete financial statements for 2021 and 2020 are not included in it. They should.
2/
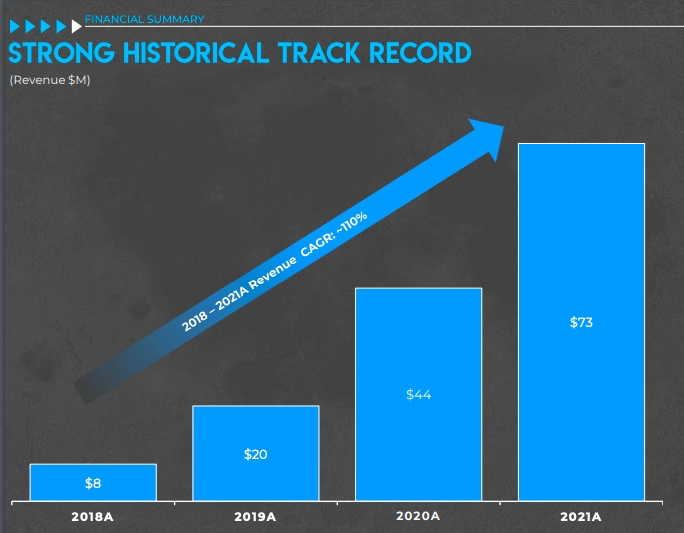
Instead we are treated with the value of sales 2018-2021, that shows an impressive ramp-up. Nice, but how much loss was accumulated in the period? And since 2013? Would be nice to know. 3/