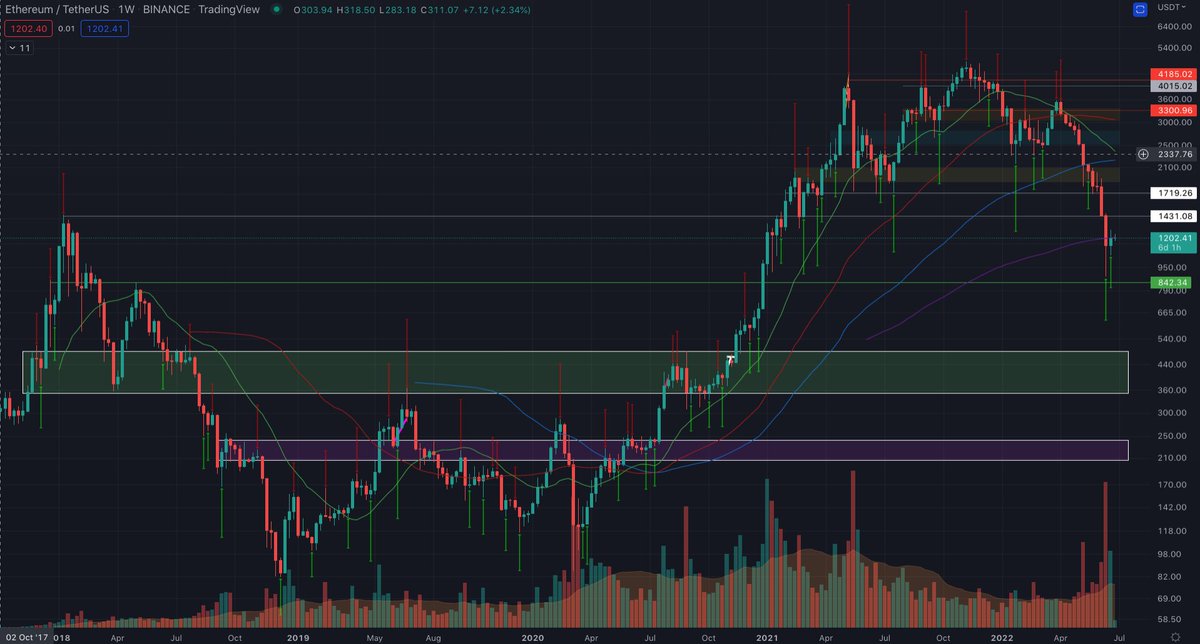
1/8 Some conflicting clues for #Ethereum around the Weekly candle close last night. With the Monthly close flowing into the 4th of July holiday weekend, expecting some extra fireworks.
A 🧵using #TechnicalAnalysis and #TrendPrecognition to analyze #ETH...
A 🧵using #TechnicalAnalysis and #TrendPrecognition to analyze #ETH...

2/8 Sunday night in the final hour or so before the Weekly candle close, #ETH price was suppressed < $2 below the 200 WMA. Moments after the W close/open, price reclaimed the 200 WMA. PA has danced above and below the line since. 

3/8 Regardless of whether #ETH can close this week above the 200 WMA, the retest has already been invalidated. Will look to next week to see if we can open and close a full candle body above the 200, that is if it doesn't retest the lows first. 

4/8 There's another reason to think #ETH might retest the low. Besides the weakness around the 200 WMA, the 21 WMA is on course to cross below the 100 WMA. Sure that may be a lagging indi, but it's going to trigger some algos, so expecting more downside like last time it crossed. 

5/8 Despite the above, there are also some short term bullish #TradingSignals. Trend Precognition printed a Long on the weekly candle close and is currently flashing a new Long signal on the adjacent candle. That signal won't validate/invalidate until the current W candle closes. 

6/8 Technical Analysis is giving clues that #ETH will breakdown further relative to losing the 200 WMA and the pending intersection of the 21 and 100 WMAs. Meanwhile, both the A1 and A2+ Trend Precognition algos are showing Long signals on the W chart. So which should we follow? 

7/8 I have so much confidence in Trend Precognition that I'm not willing to ignore it. Nothing is 100%, but I can't deny the track record. Besides, in this case the TA is a more macro perspective then the indicators, and that actually leaves room for both things to play out...
8/8 At this point, it would be great to see a spike up and a retest of the lows, but tbh, it could happen in any order between now and the Weekly close or soon after the holiday weekend. #NFA Just opinions and theories. 

* Weekly - Monthly
• • •
Missing some Tweet in this thread? You can try to
force a refresh


