
Kids <2 yrs old can’t mask.
Kids <6 months can’t vax.
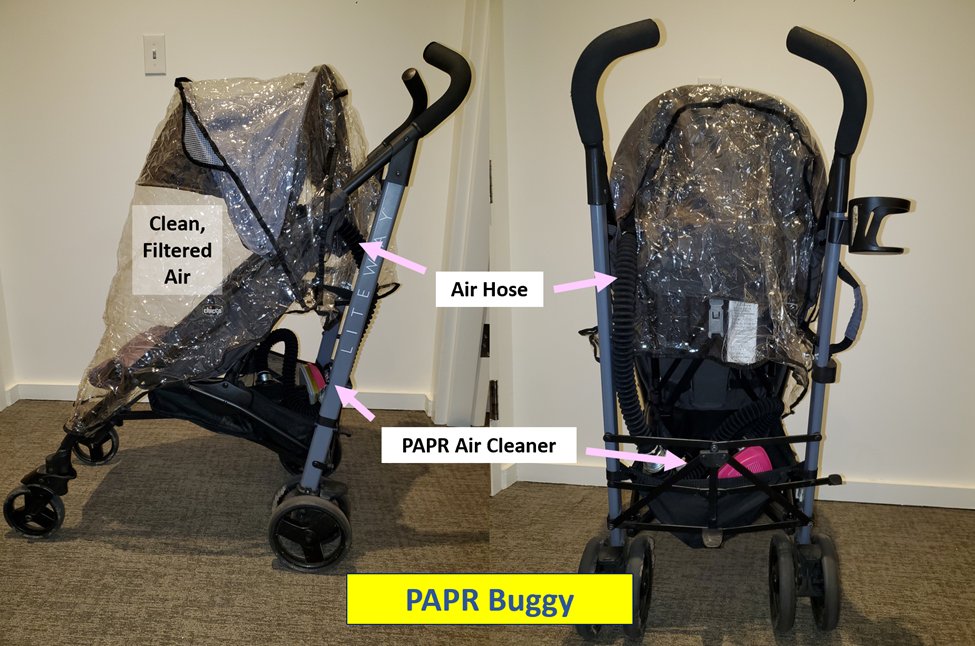
Many parents are using strollers w/rain covers to try to get some protection during essential activities.
Does adding a #PAPR or #HEPA device help?
I tried 6 models:
#PAPRbuggy #HEPAbuggy
1/10 engrxiv.org/preprint/view/…
Kids <6 months can’t vax.
Many parents are using strollers w/rain covers to try to get some protection during essential activities.
Does adding a #PAPR or #HEPA device help?
I tried 6 models:
#PAPRbuggy #HEPAbuggy
1/10 engrxiv.org/preprint/view/…

First off, thanks @RealSexyCyborg for the original design. Thanks to @ccwake1, @gjmf, @drgregkelly for ideas too. Happy to acknowledge!
My goal was to test 6 models & help relate them to non-engineers.
2/10
My goal was to test 6 models & help relate them to non-engineers.
2/10
https://twitter.com/RealSexyCyborg/status/1495615637204393984
The PAPR & HEPA buggies I tested had an estimated 57-951 air changes per hour (ACH) in these TINY spaces. The worst design had about 3x the air cleaning of an OR.
You can make a #PAPRbuggy that’s super discrete for about $110 more than an existing stroller & rain cover.
3/10
You can make a #PAPRbuggy that’s super discrete for about $110 more than an existing stroller & rain cover.
3/10
With even a cheapo ($55) HEPA, you can make a relatively discrete #HEPAbuggy w/good air cleaning (see Figure A1.5 in preprint).
BUT, I also tested some power models. This one runs at an estimated 900+ ACH, or about 60x the minimum rate of an OR. 😎 Vroom vroom.
4/10
BUT, I also tested some power models. This one runs at an estimated 900+ ACH, or about 60x the minimum rate of an OR. 😎 Vroom vroom.
4/10
Want to learn more about a #PAPRbuggy or #HEPAbuggy?
See the preprint:
🔸 Figure A1: Design ideas
🔸 Tables 1 & A4: Estimated specs
🔸 Table A3: Parts & supplies w/links
🔸 Tables A1-A2: Help w/any calculations
engrxiv.org/preprint/view/…
5/10
See the preprint:
🔸 Figure A1: Design ideas
🔸 Tables 1 & A4: Estimated specs
🔸 Table A3: Parts & supplies w/links
🔸 Tables A1-A2: Help w/any calculations
engrxiv.org/preprint/view/…
5/10

If you are a COVID-cautious parent, be forearmed that trolls will troll.
Sticks & stones. I knight you a #PublicHealth ambassador. Stand tall. Your work is needed.
Check out Table A5 for what to expect (final page).
engrxiv.org/preprint/view/…
6/10
Sticks & stones. I knight you a #PublicHealth ambassador. Stand tall. Your work is needed.
Check out Table A5 for what to expect (final page).
engrxiv.org/preprint/view/…
6/10
https://twitter.com/michael_hoerger/status/1543378821990301696
If you’re a #COVID-cautious #parent, I also hope you’ll read the 1st paragraph of this paper (pg. 3).
✅ You’re doing the right thing
✅ You’re smart
✅ Feel validated
✅ Reference #7 is absolutely damning
✅ Kids deserve a better world
engrxiv.org/preprint/view/…
7/10
✅ You’re doing the right thing
✅ You’re smart
✅ Feel validated
✅ Reference #7 is absolutely damning
✅ Kids deserve a better world
engrxiv.org/preprint/view/…
7/10
H/t 🎩to @sri_srikrishna for the #CorsiRosenthalBox article that inspired my write up.
sciencedirect.com/science/articl…
Thanks also to @JimRosenthal4, @CorsIAQ, @joeyfox85, and others for teaching about air cleaning
8/10
sciencedirect.com/science/articl…
Thanks also to @JimRosenthal4, @CorsIAQ, @joeyfox85, and others for teaching about air cleaning
8/10
I posted Naomi’s original design, but also check out Greg’s "Pram-PAPR." He’s got a different air filter & older child.
Mine are baby twins, so I’ve got some different models in the paper & will test out more double strollers down the line too.
9/10
Mine are baby twins, so I’ve got some different models in the paper & will test out more double strollers down the line too.
9/10
https://twitter.com/drgregkelly/status/1536980465810567168
Thank you for your advocacy - @MamaWeasleyy, @PTF_org, @Annalisa840917, @mir_ocall, @maskupmama, #ImmunizeUnder5s #covidkids
Please share the #PAPRbuggy & #HEPAbuggy with families of young children!
If I have to 🔒 my account, send the link:
engrxiv.org/preprint/view/…
10/10
Please share the #PAPRbuggy & #HEPAbuggy with families of young children!
If I have to 🔒 my account, send the link:
engrxiv.org/preprint/view/…
10/10
• • •
Missing some Tweet in this thread? You can try to
force a refresh


