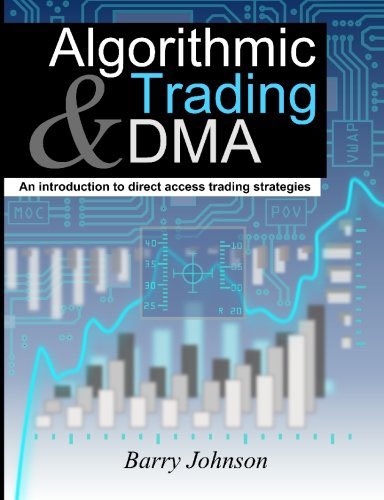
Last day I provided my trading team (they adjust our algos and monitor the market and our PnLs) a list of books that would be great to read if you start being interested in HFT.
Market Microstructure in Practice - Good book especially about the fragmentation of the market (which is a very interesting topic in the crypto universe), some basic stuff related to the algorithms in HFT
Algorithmic Trading and DMA - Very good book related to the AlgoTrading. A lot of knowledge about order types, DMA, execution algorithms etc. I recommend it for the first book after you gain some basic knowledge.
High-Frequency Trading - Very good book if you try to implement your HFT algos and want to get some insight on how to use information from the orderbook. A good chapter about volume clock from De Prado.
Now the most important thing - nobody can do it for you. Just grab the book, sample of some data and try to do something. I hope guys from my team will do it as well. If not - I will complain about them here on Twitter.
• • •
Missing some Tweet in this thread? You can try to
force a refresh
Today’s dump resulted in the biggest liquidation since 2021. I would like to present a microstructure view of this entire situation. As always, this thread is full of insights, charts, and comments.
Retweet if you enjoyed the analysis.
Firstly, when discussing this kind of dump, we need to determine where the pressure was greatest. We observed something crazy—Coinbase traders began selling aggressively almost an hour before the mega dump.
Of course, the biggest drop was triggered by a liquidation cascade, but this constant selling pressure was crucial in pushing the price into a region where overleveraged positions were forced to close. How can we tell that the market was overheated? It’s simple—the Funding Fee plus the increase in Open Interest. These two factors are drivers of the current market and indicate that people are overleveraged.
Korea declared Martial Law. It was one of the most spectacular trading events I've ever witnessed in my trading career. I've prepared detailed explanations of what exactly happened in the market and why it was so different from any other event. If you enjoyed it, please retweet!
BTC on Upbit was priced under $65k, while we saw almost $95k on Binance— $30k difference between Korea and the rest of the world. That was absolutely crazy. We observed big sell pressure, with almost $7mm more in sell orders than buy orders. The next plot is the most important.
Here, we have the price action as well as CVD for USDTKRW. You can see that about $50mm was sold in a couple of minutes. With normal liquidity, that would not have been so brutal, but all the players just disappeared from the market, causing a drop to 75 cents.
As you can see on the plot, price action of BTC and TRUMP winning elections is pretty similar. Significant moves were seen both on BTC and TRUMP from around midnight UTC.
Let's deep dive a little bit more into the data.
#Election2024
It can be seen that in time of bigger volatility BTC was reacting much faster that polymarket. The time difference is of course much, much bigger than block time.
Here we have regression plot for price differences (15 minutes) on BTC and TRUMP. You can clear see how correlated they are.
I've read and analyzed the book “Going Infinite” by Michael Lewis about SBF. I'll try to show you interesting quotes, problems, lies, and why the fundamental problem was that SBF was a complete chronic liar. I’ve worked on it for a few days and it'll be a big thread.
1/43 🧵
[2/43] I am going to split the topics into four parts: the book, SBF, FTX, and overall conclusions. All of the topics will be described with examples, quotes, and my own analysis and opinions.
[3/43] The first thing is the book - most of it (~70%) is about idealizing SBF and creating an image of a genius and the most generous person in the world. All of the worst possible personality traits were justified by his greatness.
[1/n] Friday’s night crash was very interesting because there was no big news at this moment and some of the instruments fell about 50% within two hours. I would like to break down the microstructure behaviors and do an overall analysis from that day. 🧵
Firstly, let’s take a look at the macroscopic view of the market. On the histogram, we can see the changes from the highest price to the lowest price within the first couple of hours of June 10th (UTC). Big moves around the whole crypto space.
Some of the instruments fell about 50% and GTC fell over 73% due to the fact that during such crashes, liquidity is poor. This example can show you how liquidity is important when there is huge volatility in the market. Unfortunately, this move happened during the weekend.
[1] The hottest topic in the crypto universe last couple of days was $PEPE - a meme coin that went to top 40 coins and was the biggest meme surprise since SHIB in October 2021. How did the market look in the HFT data? Let’s see! 🧵🧵
[2] I focus on CEX trading because there were more analyses related to the $PEPE and trading on DEXes, such as the great thread by @thiccythot_ which can bring you a lot of value in terms of understanding what happened on $PEPE. Highly recommended thread.
[3] What is important in terms of the analysis of $PEPE is that we should divide our analysis into two periods: The first move with only a couple of exchanges that had $PEPE listed with really small liquidity and the second move with other exchanges in the game such as OKX.