In this Thread, We will cover important Bullish and Bearish CandleSticks.
Retweet 🇮🇳 Like ♥️ Follow 📊
Tags:
@nakulvibhor
@sumeetsmt
@Keval5571
@cobbervipul
Open this Thread 🧵
#trading #candles #stockmarkets #Bullish #Bearish #markets
Retweet 🇮🇳 Like ♥️ Follow 📊
Tags:
@nakulvibhor
@sumeetsmt
@Keval5571
@cobbervipul
Open this Thread 🧵
#trading #candles #stockmarkets #Bullish #Bearish #markets

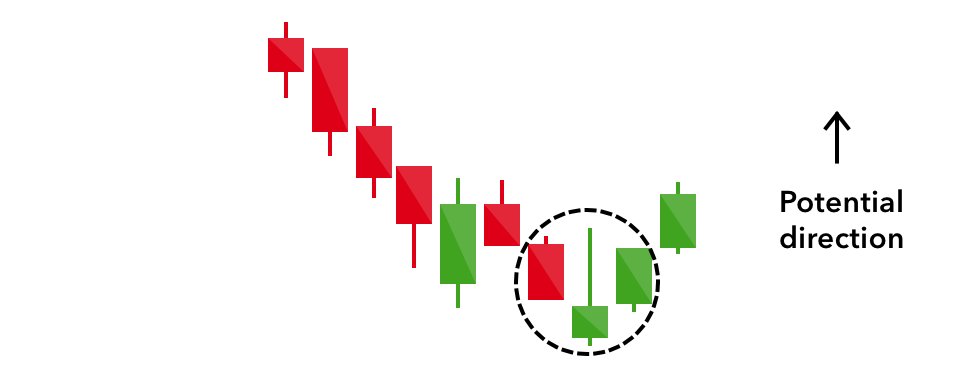
1. Hammer
The hammer candlestick pattern is formed of a short body with a long lower wick, and is found at the bottom of a downward trend.
A hammer shows that although there were selling pressures during the day, ultimately a strong buying pressure drove the price back up.
The hammer candlestick pattern is formed of a short body with a long lower wick, and is found at the bottom of a downward trend.
A hammer shows that although there were selling pressures during the day, ultimately a strong buying pressure drove the price back up.

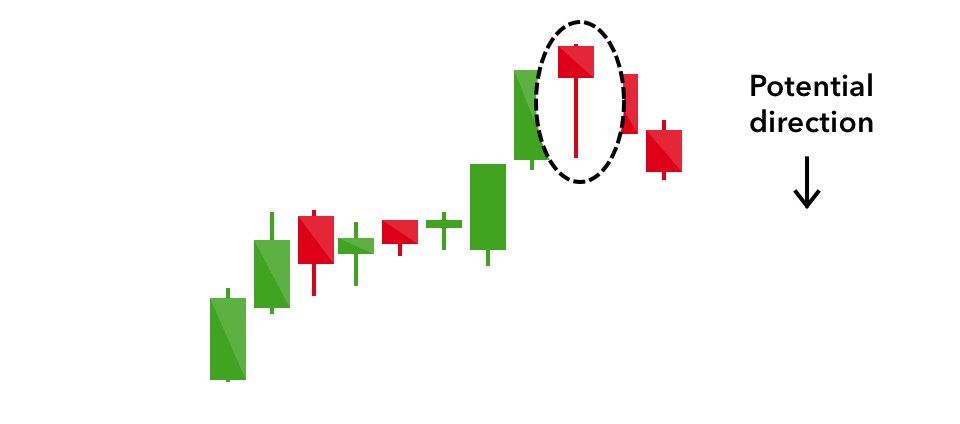
2. Shooting Star
The shooting star is the same shape as the inverted hammer, but is formed in an uptrend: it has a small lower body, and a long upper wick.
The shooting star is the same shape as the inverted hammer, but is formed in an uptrend: it has a small lower body, and a long upper wick.

3. Inverted Hammer
A similarly bullish pattern is the inverted hammer. The only difference being that the upper wick is long, while the lower wick is short.
It indicates a buying pressure, followed by a selling pressure that was not strong enough to drive the market price down.
A similarly bullish pattern is the inverted hammer. The only difference being that the upper wick is long, while the lower wick is short.
It indicates a buying pressure, followed by a selling pressure that was not strong enough to drive the market price down.

4. Hanging Man
The hanging man is the bearish equivalent of a hammer; it has the same shape but forms at the end of an uptrend.
It indicates that there was a significant sell-off during the day, but that buyers were able to push the price up again.
The hanging man is the bearish equivalent of a hammer; it has the same shape but forms at the end of an uptrend.
It indicates that there was a significant sell-off during the day, but that buyers were able to push the price up again.

5. Dragonfly Doji
The Dragonfly Doji can appear at either the top of an uptrend or the bottom of a downtrend and signals the potential for a change in direction.
The Dragonfly Doji can appear at either the top of an uptrend or the bottom of a downtrend and signals the potential for a change in direction.

6. Gravestone Doji
The Gravestone Doji is the opposite of the Dragonfly Doji. It appears when price action opens and closes at the lower end of the trading range.
The Gravestone Doji is the opposite of the Dragonfly Doji. It appears when price action opens and closes at the lower end of the trading range.

7. Morning Star
The morning star candlestick pattern is considered a sign of hope in a bleak market downtrend. It is a three-stick pattern: one short-bodied candle between a long red and a long green.
The morning star candlestick pattern is considered a sign of hope in a bleak market downtrend. It is a three-stick pattern: one short-bodied candle between a long red and a long green.

8. Evening Star
The evening star is a three-candlestick pattern that is the equivalent of the bullish morning star. It is formed of a short candle sandwiched between a long green candle and a large red candlestick.
The evening star is a three-candlestick pattern that is the equivalent of the bullish morning star. It is formed of a short candle sandwiched between a long green candle and a large red candlestick.

9. Three White Soldiers
The three white soldiers pattern occurs over three days. It consists of consecutive long green (or white) candles with small wicks, which open and close progressively higher than the previous day.
The three white soldiers pattern occurs over three days. It consists of consecutive long green (or white) candles with small wicks, which open and close progressively higher than the previous day.

10. Three black crows
The three black crows candlestick pattern comprises of three consecutive long red candles with short or non-existent wicks.
Each session opens at a similar price to the previous day, but selling pressures push the price lower and lower with each close.
The three black crows candlestick pattern comprises of three consecutive long red candles with short or non-existent wicks.
Each session opens at a similar price to the previous day, but selling pressures push the price lower and lower with each close.

• • •
Missing some Tweet in this thread? You can try to
force a refresh


