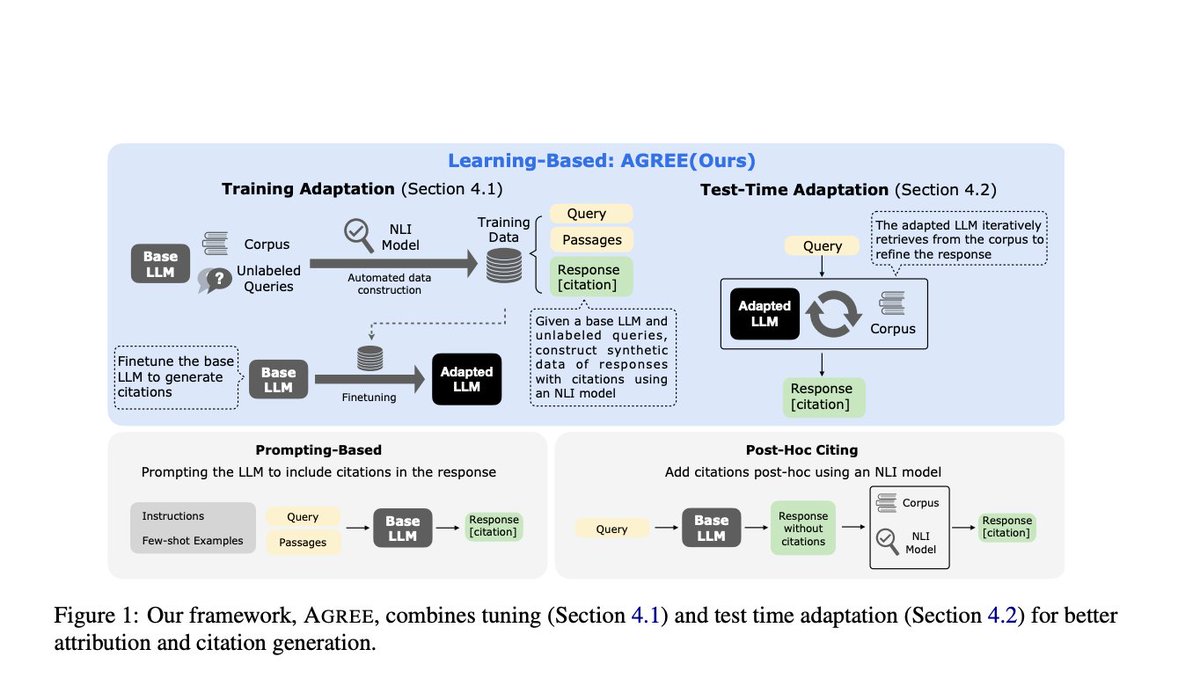
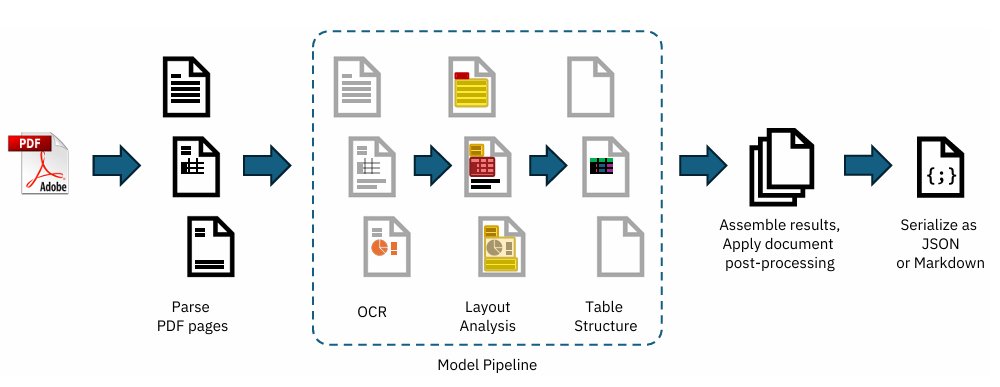
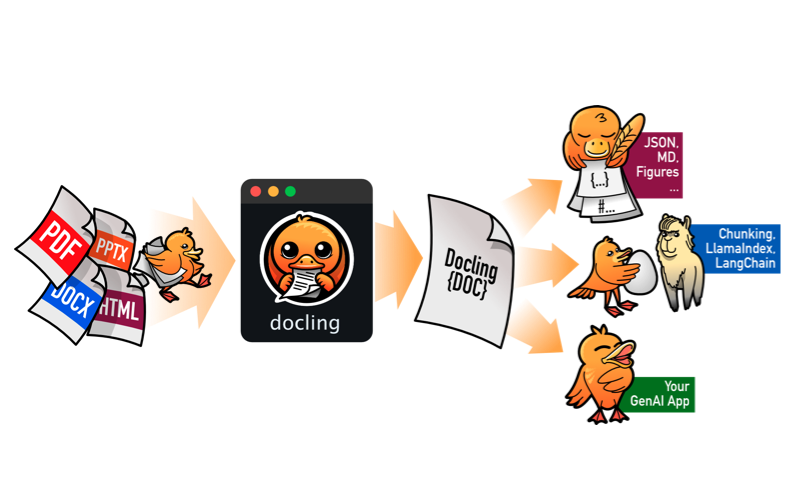
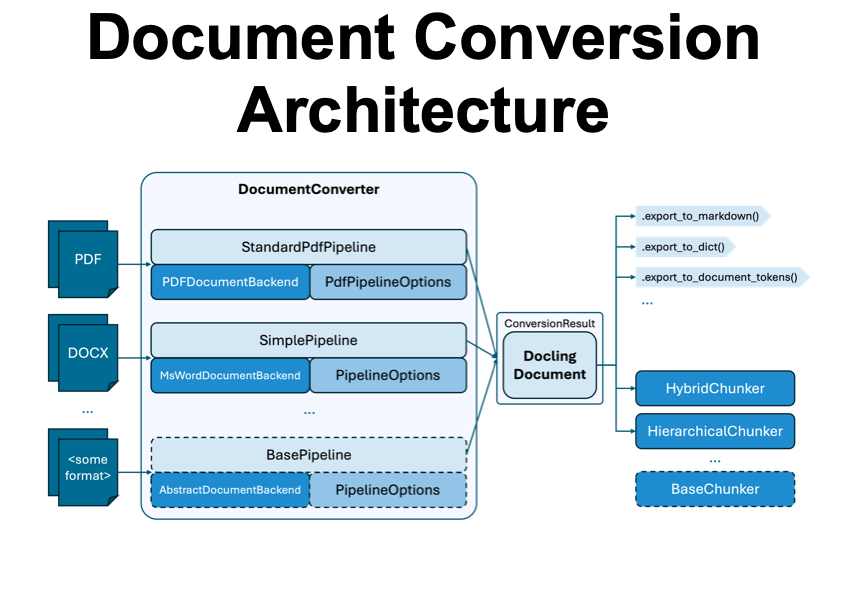
What could go wrong?

LOL. 😂

Plus the 3 #datascience books that helped me learn #stats the most. 🧵

#rstats Image
I’m not saying you need to be an expert in advanced calculus to do machine learning…

BUT, there is a big difference between someone that does vs someone that does NOT have a good foundation in stats when it comes to getting & explaining business results.
My thought process back in the day was to obtain a great foundation in stats and machine learning at the same time.

So here’s what helped me. I read a ton of books.

Here are the 3 books that helped me learn data science the most...
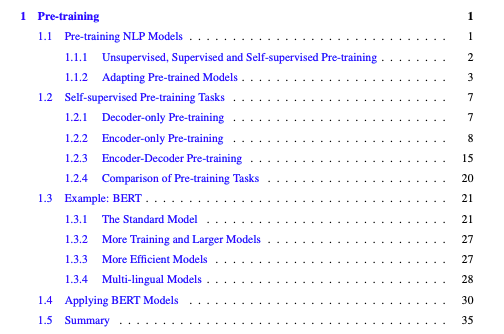
1. R for Data Science (Wickham & Grolemund) r4ds.had.co.nz
2. Introduction to Statistical Learning (James, Witten, Hastie, & Tibshirani) statlearning.com
3. Applied Predictive Modeling (Kuhn & Johnson) appliedpredictivemodeling.com
Keep in mind that I’ve read 300+ books on stats, ML, time series, …

But these were the 3 best. Ones I got a ton of applied value out of.
Now you’re probably thinking reading these 3 books will take a long time, and still might not get you the whole way to data scientist.

That’s why I want to help you speed up the process.

So it doesn’t take you 5 years to learn data science (like it did me).
I compiled the top 10 most important skills that helped me learn and get results from data science.

And I put these top 10 data science skills into a FREE 40-minute webinar.

Enjoy!

learn.business-science.io/free-rtrack-ma… Image

• • •

Missing some Tweet in this thread? You can try to force a refresh
 

Keep Current with 🔥 Matt Dancho (Business Science) 🔥

🔥 Matt Dancho (Business Science) 🔥 Profile picture

Stay in touch and get notified when new unrolls are available from this author!

Read all threads

This Thread may be Removed Anytime!

PDF

Twitter may remove this content at anytime! Save it as PDF for later use!

Try unrolling a thread yourself!

how to unroll video
  1. Follow @ThreadReaderApp to mention us!

  2. From a Twitter thread mention us with a keyword "unroll"
@threadreaderapp unroll

Practice here first or read more on our help page!

More from @mdancho84

Jul 4
Principal Component Analysis (PCA) is the gold standard in dimensionality reduction.

But PCA is hard to understand for beginners.

Let me destroy your confusion: Image
1. What is PCA?

PCA is a statistical technique used in data analysis, mainly for dimensionality reduction. It's beneficial when dealing with large datasets with many variables, and it helps simplify the data's complexity while retaining as much variability as possible.
2. PCA has 5 steps:

1. Standardization
2. Covariance Matrix Computation
3. Eigen Vector Calculation
4. Choosing Principal Components
5. Transforming the data
Read 12 tweets
Jul 1
🚨 Say goodbye to manual ETL

Cleaned a 100k-word PDF dataset in 3 lines of Python code: Image
1. What is DocETL?

DocETL is a system for LLM-powered data processing.

You can create LLM-powered data processing pipelines. Image
2. Quick Example:

I made a quick, messy-PDF-to-Structured Output pipeline in 3 lines of Python: Image
Read 7 tweets
Jun 30
🚨 Synthetic Data is the Future of AI

Introducing The Synthetic Data Vault (SDV).

This is what you need to know: Image
Synthetic Data is the Future of AI

Synthetic data keeps your data private.

SDV generates fake datasets that look REAL.

Here's how: Image
I built a 100k-row customer dataset in 4 lines:

Perfect for HIPAA-compliant Machine Learning & AI.

Google Colab Example: colab.research.google.com/drive/1L6i-JhJ…Image
Read 7 tweets
Jun 29
Logistic Regression is the most important foundational algorithm in Classification Modeling.

In 2 minutes, I'll crush your confusion.

Let's dive in: Image
1. Logistic regression is a statistical method used for analyzing a dataset in which there are one or more independent variables that determine a binary outcome (in which there are only two possible outcomes). This is commonly called a binary classification problem.
2. The Logit (Log-Odds):

The formula estimates the log-odds or logit. The right-hand side is the same as the form for linear regression. But the left-hand side is the logit function, which is the natural log of the odds ratio. The logit function is what distinguishes logistic regression from other types of regression.Image
Read 9 tweets
Jun 27
These 7 statistical analysis concepts have helped me as an AI Data Scientist.

Let's go: 🧵 Image
Step 1: Learn These Descriptive Statistics

Mean, median, mode, variance, standard deviation. Used to summarize data and spot variability. These are key for any data scientist to understand what’s in front of them in their data sets. Image
2. Learn Probability

Know your distributions (Normal, Binomial) & Bayes’ Theorem. The backbone of modeling and reasoning under uncertainty. Central Limit Theorem is a must too. Image
Read 12 tweets
Jun 27
🚨BREAKING: New Python library for Bayesian Marketing Mix Modeling and Customer Lifetime Value

It's called PyMC Marketing.

This is what you need to know: 🧵 Image
1. What is PyMC Marketing?

PyMC-Marketing is a state-of-the-art Bayesian modeling library that's designed for Marketing Mix Modeling (MMM) and Customer Lifetime Value (CLV) prediction.
2. Benefits

- Incorporate business logic into MMM and CLV models
- Model carry-over effects with adstock transformations
- Understand the diminishing returns
- Incorporate time series and decay
- Causal identification Image
Read 9 tweets

Did Thread Reader help you today?

Support us! We are indie developers!


This site is made by just two indie developers on a laptop doing marketing, support and development! Read more about the story.

Become a Premium Member ($3/month or $30/year) and get exclusive features!

Become Premium

Don't want to be a Premium member but still want to support us?

Make a small donation by buying us coffee ($5) or help with server cost ($10)

Donate via Paypal

Or Donate anonymously using crypto!

Ethereum

0xfe58350B80634f60Fa6Dc149a72b4DFbc17D341E copy

Bitcoin

3ATGMxNzCUFzxpMCHL5sWSt4DVtS8UqXpi copy

Thank you for your support!

Follow Us!

:(