1/ Have you seen the New Non-Nutritive sweeteners paper in Cell making the rounds!?! Fantastic!
Here's a video rundown:
And this thread contains a brief tweetorial...
2/ This study took 120 young health people who didn't consume non-nutritive sweeteners (NNS) and broke them into 6 groups, n = 20/group
👉 Control (no supplement)
👉 Glucose
👉 Sacchrin
👉 Sucralose
👉 Aspartame
👉 Stevia
7 day baseline, 14 day exposure, and 7 day follow-up
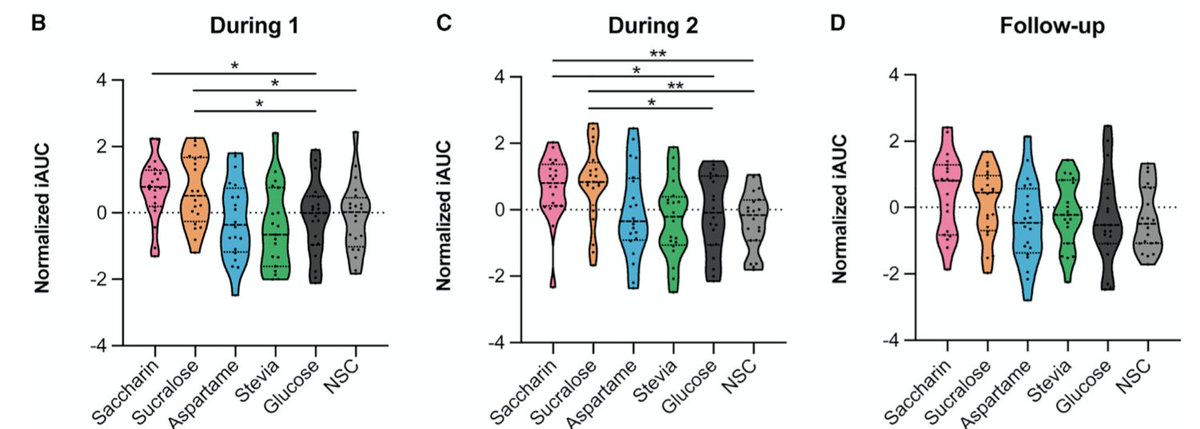
3/ There was a clear individualized response across NNS, with Sucralose and Saccharin having the largest impact on glucose tolerance on oral glucose tolerance test.
There were "responders" (who had worse glucose tolerance in response to NNS) and also non-responders.
4/ B = week 1, C = week 2, and D = follow-up (no sweetener)
Note how the pink and orange distributions get vertically squeezed in C compared to B. This appears to suggest that, overtime, non non-responders converted to responders
5/ Also, note in D (follow-up), that responders tended to revert to baseline, meaning the negative impact was reversible... PHEW!☺️
6/ The researchers were also able to show the effect was MEDIATED BY THE MICROBIOME
When then transferred fecal/microbiome transplants from participants to mice without microbiomes, the mice adopted the metabolic profiles of the responders/non-responders
7/ There were many brilliant nerdy nuggets throughout the paper. I'll highlight just one
When they look at profiles of responders vs non-responders for Sucralose, a major difference the popped out was baseline #ketone (BHB) levels
Look at top row...
8/ Responders (impaired glucose tolerance after Sucralose) had LOW ketone [dark blue]at baseline vs. non-responders had HIGH ketone [dark red] at baseline.
Then, levels went in opposite directions after exposure to Sucralose!
What gives?!
9/ While they data certainly do not confirm this, one might SPECULATE, that baseline metabolic state/dietary choice (re #ketogenic diet) could influence whether one is a responder/non-responder to Sucralose, which incidentally is the sweetener in @ketochow
10/ Speaking more broadly, I think it's possibly - if not likely - that dietary choice could influence how one responds to NNS
For example, it's previously been shown carbs + NNS might be worse than NNS alone
11/ Again, here's a link to a verbal video rundown. Certainly a stellar paper. The @Elinav_Lab group always produces incredible research! Very grateful for them!
• • •
Missing some Tweet in this thread? You can try to
force a refresh
Untangling the Seed Oil Debate: ⚠️WARNING ⚠️Don’t Read If You Like Your Echo-Chamber
(🔗 at the end)
1/11) One of the most heated and fascinating debates in the nutrition space right now is that of “seed oils.”
It’s one of the keystone issues for the “Make America Healthy Again” #MAHA movement.
Robert F. Kennedy Jr., who calls the seed oils in which fast food chains now cook their French fries, “one of the most unhealthy ingredients we have in foods.”
This has led to a counterculture movement to replace industrialized plant-sourced fats, i.e., “seed oils,” with animal fats. There are cries to “Bring Back the Tallow Fries” to fast food chains like McDonald’s—the dietary version of “Make Fries Great Again.”
Up-front Acknowledgement
I spoke with several others composing this letter, including @drmarkhyman @paulsaladinomd @Physionic_PhD. Each provided references, input and/or feedback that was included in this letter in some form, and I look forward to ongoing conversations with each about this particularly controversial topic.
In fact, I’m releasing this letter now, rather than late July as originally planned, because I have a conversation planned with one of these men next week and thought community feedback would be ‘interesting’ fodder for our discussion.
The letter, should you choose to read it, may end up being a living document…
2/11) Restaurant chains are responding, literally “RFK’ing the fries,” meaning trading the seed oils for tallow for presumed health benefits.
But this isn’t really an issue or video about French fries. It’s about something much larger and more important.
It’s about how we dissect conflicting data in nutrition.
The reason there is such profound confusion on the topics of animal vs. plant fats and “seed oils” is because different sources of evidence make opposing arguments, and each side thinks their argument is best.
Rather than try to resolve the inconsistencies, we dismiss and bicker.
But in today’s letter, we try to dig into the details with data (nor dogma). This one is intense, but I hope you find it valuable.
3/11) Let’s start with a roadmap.
👉 I want to discuss the physiological rationale for why seed oil fries are presumed to be harmful, and why tallow fries might be better.
👉 Building on this French fry case in point, I want to expand the discussion to the human trial data on omega-6 fats and cardiovascular disease.
👉 Then, we will resolve the apparent contradictions that emerge.
👉 Finally, I’ll close by telling you what I think is practical and reasonable when it comes to handling fries, nuts, cooking fats, and making your food choices healthy (again?).
Salmon Savvy: The Ultimate Guide to Choosing the Cleanest, Healthiest Fish
1/6) Salmon might wear the health halo, but not all salmon are created equal. Some are top-tier nutrition, and others are … well… toxic might not be an overstatement. Let’s talk fish fraud and how to avoid getting catfished at the seafood counter.
Let’s start with the elephant in the room—or manatee in the pool, as it were: farm-raised vs. wild salmon.
Is wild really better? YES.
The primary reason I always go wild over farm-raised is that farm-raised salmon tend to have much higher levels of chemicals like polychlorinated biphenyls (PCBs), pesticides, and dioxins, which largely derive from their feed and all of which have serious negative consequences on human health.
2/6) To take one of these as a representative example: dioxins, which are byproducts of various industrial processes such as burning waste, smelting metals, and bleaching. Some dioxins, like TCDD, are classified as Group I carcinogens (known to cause cancer in humans).
One study found that when eating farm-raised salmon, it would be easy to exceed the tolerable daily intake (TDI) of dioxins based on thresholds set by the World Health Organization. In some cases, as little as 4 servings of farm-raised salmon per month would push you past the dioxin TDI. By comparison, this analysis found that you could eat wild salmon every day (even twice per day!) and remain within safe levels of dioxin exposure.
What you’re seeing in the graph is the number of meals per month you’d need to eat of farm-raised salmon (white and light blue) or wild salmon (dark blue) to breach the safe intake limit. For farm-raised salmon, you can see only a handful of small servings will push you beyond the safe limit. But for wild salmon, they actually capped the analysis at “a practical consumption rate” of 60 meals/month.
3/6) Now let’s begin to revie some salmon types & terms. Most of the salmon you’ll see is Atlantic salmon, which is mostly farm-raised. These include Faroe Island, Norwegian, and Scottish, named for their geographic origins.
*Faroe Island salmon are often sold at restaurants at a premium price because they tend to be extra fatty and tasty. However, one credit I’ll give Faroe Island salmon is that they are generally raised without antibiotics.
*Norwegian salmon is quite common. About one-fifth of the salmon in the United States comes from Norway, and they are antibiotic-free 99% of the time.
*Scottish salmon. I don’t have much to say on these, although I’ve noted some scandals in the media. So, I suppose I’d just say so Scottish salmon are like a kilt… look traditional, but underneath it might be hiding something questionable.
(the difference you're seeing there is Faroe Island vs Alaskan Sockeye... to come)
🥛This Saturated Fat Can Burn Fat: A Milkshake Experiment?!🥛 (🔗at the end)
Saturated fat is one of the most misunderstood nutrients in nutrition. Part of this misunderstanding stems from a stereotype: Saturated fats are often lumped together as if they are homogenous entity.
But they are not.
1/7) In today’s StayCurious Metabolism Letter, I make the point by reviewing data showing how one specific saturated fat, stearic acid, positively influences mitochondrial fusion-fission dynamics and fat metabolism.
At the end I also provide you a boarder evolutionary framework in which to understand these data and related general principles of nutrition and offer some practical takeaways
2/7) Stearic acid is an 18-carbon saturated fat found in certain tallow, cocoa butter, and shea butter.
👉The study in question set out to investigate the effects of stearic acid, an 18-carbon saturated fat (C18:0), on mitochondria. The researchers took a diverse group of individuals—including those who were healthy and those with type 2 diabetes—and placed them on a low-fat vegan diet for two days in order to reduce their saturated fat and stearic acid intake.
They then gave the participants a stearic acid milkshake (24g of C18:0) or a mock control shake looked at the participants’ mitochondria at 0, 3, and 6 hours later.
🚨When given stearic acid, but not the control, the percentage of “fused” mitochondria increases ~4-fold. This did not happen with the control drink.
🚨By contrast, stearic acid restriction in the form of the low stearic acid vegan diet caused mitochondria to fracture and fragment. (More on the long-term effects later.)
If you want a pop-culture analogy, think of it like assembling the Avengers. Individually, they’re impressive, but together, they’re more powerful. In fusing, the mitochondria become temporarily more efficient and productive.
But when it comes to heart health 🫀, Vitamin C is wildly underrated. We think we understand it. But we don’t. And what I found when I dove into the science shocked me. (🔗 with all references at the end)
First, a quick hat-tip to what had me running down this rabbit hole. I recently wrote a newsletter on Lp(a) that was my most popular to date. I encourage you to check that out if you’re interested in heart health.
But here’s what you need to know: Lp(a) is like LDL’s evil twin—the one that went to villain school and graduated top of its class in blood clotting. And Lp(a) is that’s thought to be genetically cemented.
However, some people have had anecdotal success lowering Lp(a) with high-dose vitamin C supplementation.
Weird, right? But it got my curious and started down another rabbit hole. I’ve broken today’s newsletter into 8 chapters:
1. Vitamin C & Lp(a) – Nature’s substitution 2. Vitamin C & Heart Disease – The human data 3. Vitamin C & oxLDL – Can it stop cholesterol from turning toxic? 4. Vitamin C & Nitric Oxide – Why your blood vessels care 5. Mechanistic Summary – Piecing together the puzzle 6. Vitamin C Dosing – How much do you really need? 7. Vitamin C & Lysine – Batman & Robin 8. Puzzling Together the Protocol
2/8) Vitamin C and Lp(a)
Lp(a) is a spherical particle that floats around in the blood. It looks like an LDL particle, except Lp(a) also has a protein tail called apolipoprotein(a). This tail endows Lp(a) with the ability to promote blood clots and is one way in which Lp(a) is thought to promote cardiovascular disease, atherosclerosis.
But in 1990, the double Nobel Laureate Linus Pauling and his colleague Dr. Rath came up with an interesting idea about Lp(a). They hypothesized that Lp(a) was a surrogate for vitamin C.
Most mammals can synthesize their own vitamin C. But about 40 - 60 million years ago, our primate lineage developed a mutation in the GLO gene that prevents us from synthesizing vitamin C. Since vitamin C helps to promote wound healing, this would have placed an environmental pressure to develop an alternative means to promote wound healing and halt bleeding. In effect, evolution called for a substitute: Lp(a), which can likewise promote wound healing.
Now, if it were true that Lp(a) is an evolutionary substitute and surrogate for vitamin C, we might expect a pattern whereby animals that can synthesize vitamin C lack Lp(a). This is indeed the case!
What’s more, species that have also lost the ability to synthesize vitamin C, including guinea pigs and the European hedgehog, also produce Lp(a).
3/8) Across the animal kingdom, there’s a pattern: Where the ability to synthesize vitamin C remains, Lp(a) is missing. Where the ability to synthesize vitamin C is lost, Lp(a) is present. This provides one comparative evolution argument that Lp(a) is a surrogate for vitamin C.
But the intrigue doesn’t stop there. Chasing these observations, Pauling and Rath performed experiments where they deprived guinea pigs of vitamin C, which was sufficient to cause them to develop rapid atherosclerosis characterized by plaques filled with Lp(a). Conversely, when guinea pigs were given vitamin C, negligible amounts of Lp(a) could be found in their arteries.
☕How to Drink Coffee for Heart Health (Backed by Science)🫀🔗at the end (5/5)
1/5) What if I told you coffee was good for your heart?
Indeed, coffee isn’t just keeping you alive during Zoom meetings—it might actually be keeping you alive. In today’s letter, I’ll break down two human trials, one remarkable mouse study, the key molecule behind coffee’s heart benefits, how to dose and time your coffee for maximum impact, and what I enjoy even more than coffee these days.
First, let’s establish that there is a well-known association between coffee intake and reduced risk of cardiovascular disease—at least up to a point. But large-scale epidemiological studies provide limited insight on cause-effect relationships or mechanisms.
👉So, we turn to controlled trials and animal studies.
I want to review two human randomized controlled trials, and one fascinating animal study centered around a special chemical in coffee that is responsible for many of its health effects: chlorogenic acid.
If you follow me, you may recall chlorogenic acid from our discussions on how to stop sugar cravings or how the heart talks to the brain (these letters can be found at staycuriousmetabolism. com).
Briefly, it’s a well-studied polyphenolic compound enriched in coffee—especially lighter roasts, unroasted ‘green’ coffee, and Yerba Mate.
Let’s discuss two human randomized controlled trials. Both studies aimed to assess the effect of coffee and/or chlorogenic acid on vascular function. They measured vascular function using flow-mediated dilation (FMD), which evaluates the ability of the endothelium (the inner lining of blood vessels) to dilate in response to increased blood flow. It's a way to assess the health of blood vessels.
👉In one study, they gave participants one of two different coffees differing in chlorogenic acid content (89 mg or 310 mg), or a placebo control, and then measured FMD. As compared to the placebo, both coffees improved FMD, with the higher dose (310 mg) of chlorogenic acid appearing to have a larger effect.
To further prove it was the chlorogenic acid improving vascular function, they conducted another experiment in which they provided isolated chlorogenic acid rather than coffee. Again, the chlorogenic acid improved FMD.
👉These findings have been independently replicated. In another double-blinded randomized controlled trial, decaffeinated unroasted ‘green’ coffee containing chlorogenic acid at three different doses (302 mg, 604 mg, 906 mg) was compared to a placebo control for its effects on FMD. The chlorogenic acid significantly improved FMD versus placebo, although the higher doses did not provide additional benefit.
All in all, these studies suggest that chlorogenic acid in coffee improves vascular function.
3/5) But What About Long-Term Heart Health?🫀
Now, that’s interesting—and perhaps sufficient to justify your coffee habits. However, when it comes to long-term health, what you really want to know is whether chlorogenic acid could slow the progression of atherosclerosis, the buildup of plaque in your arteries.
Here, we can’t conduct human controlled trials because atherosclerosis takes too long to develop. Instead, we turn to animal models.
In what may be my favorite coffee-relevant paper to date, researchers gave ApoE-/- mice (predisposed to heart disease) a control diet or one supplemented with either 200 mg/kg chlorogenic acid, 400 mg/kg chlorogenic acid, or a statin (4 mg/kg atorvastatin).
Strikingly, chlorogenic acid reduced the progression of atherosclerosis at both doses, with the higher dose having the same effect size as the statin. You can see this clearly in the images on showing part of the heart with plaques circled, and in the bar graph showing atherosclerotic plaque area.
1/4) A few months ago, in March 2025, a randomized controlled trial was published that claimed to debunk the Carbohydrate Insulin Model (CIM).
In this study, 120 lean young adults (mean BMI 21-22) were assigned to one of three meals that varied in glycemic index (GI). All diets were 60% of calories from carbs, but the glycemic indices were 33, 65, and 73 for the low-, medium-, and high-GI meals, which were composed primarily of pasta or bread.
🍝Baseline: The day before the test meal, subjects were given a standard meal, buffet style, and allowed to eat as much as they wanted.
🍝Intervention: The next morning, they were given the intervention meal—either spaghetti pasta, buckwheat noodles, or steamed bread
🍝Test Meal: 5 hours later, they were given another buffet-style meal and again allowed to eat freely.
The researchers wanted to measure how much energy intake *changed* between the two buffet meals based on which intervention meal the participants received.
The CIM predicts that those who got the lower-GI intervention would have a smaller increase in calorie intake compared to those who ate the higher-GI meals.
To be crystal clear; “The primary, prespecified outcome in the registry (Clinicaltrials.gov: NCT05804942) was a change in energy intake between the baseline and test meals, powered to detect a 63 kcal group difference.”
So, what did they find?
*CC @davidludwigmd @AdrianSotoMota co-authors on letter to the editor
*All links (original paper, LTE, and reply to LTE) can be found in the newsletter version of the thread linked in 4/4
2/4) Indeed, the higher-GI diets led to larger increases in calorie intake: The low-GI group only increased by 17 calories; The medium- and high-GI groups increased by over 140 calories—more than double the effect size expected.
🤔So, why the discrepancy in interpretations?
i. First, the original research team feature an altered version of the primary outcome in stating there was “[n]o effect of GI on intake at [the] next meal.” This is a shift away from “change” in energy intake and omits the prespecified baseline, providing a notably less precise effect estimate than the more powerful change score.
ii. Second, they highlight the absence of group difference in subjective hunger ratings.
But subjective hunger is poorly correlated with objective food intake. If you’ve ever opened the fridge “just to look” and ended up eating half a cheesecake, you already know this.
To do our due diligence, we conducted an analysis and found no relationship between hunger ratings and food intake using their publicly available data.
3/4) iii. Third, the investigators emphasize the lack of associations between blood sugar after the meals and change in energy intake, as would be predicted by the CIM. But – and this is a subtle but important point, so take note – they include too much time after the meal. Most of the difference in blood sugar response between groups should occur occurred within the first ~2 hours, but they included 5 hours.
By way of simple analogy, if I force-fed you a Coke followed by Mentos and then insisted it didn’t cause gastrointestinal distress – a claim I suspect you’d contend – would it then be fair for me to counter that, “well, your stomach didn’t hurt at the 5 hour mark after I turned your GI system into an 8th grade science fair volcano.”
iv. Fourth, the original team note the lack of a “dose response,” with no difference in energy intake between the medium- and high-GI groups in post hoc analyses. However, even if the CIM specified a linear relationship between glycemic load and energy intake (it doesn’t), the contrast in GI between the low and moderate meals (33 versus 65) was much larger than between the moderate and high meals (65 versus 73).
This suggests the latter comparison is underpowered.