
Following last night’s match between Manchester United and Liverpool, I thought it might be interesting to see how the finances of these clubs compare, particularly the direction of travel over the last 10 years (up to most recent accounts for the 2020/21 season) #MUFC #LFC
10 years ago #MUFC £320m revenue was nearly twice as much as #LFC £169m with the difference rising to a peak of £217m in 2017, but since then the gap has almost completely closed to only £7m with United’s £494m just ahead of #LFC £487m. 

#LFC have earned more broadcasting income than #MUFC in each of the last four years, due to more success on the pitch, especially in Europe, where Liverpool’s exploits in the Champion League have generated much more TV money.


#MUFC earned much more match day income than #LFC in 2013 (£109m vs £45m), but the gap had narrowed to £27m in 2019 (pre-pandemic) following the expansion of Anfield’s Main Stand. Both clubs suffered from games being played behind closed doors during COVID, especially United.

In 2016 #MUFC £268m commercial income was miles higher than #LFC £116m, but United’s revenue has flatlined since then (and dropped during the pandemic), while #LFC revenue has shot up to £218m, so is now only £15m less, thanks to new sponsorship deals (Standard Chartered & Nike).

In 2014 #MUFC £215m wages were 50% more than #LFC £144m, but the gap nearly disappeared in 2021, down to just £9m (£323m vs £314m). Liverpool’s wages were higher in 2020, mainly due to bonuses: Liverpool won the Premier League, while United did not qualify for Champions League.

Similarly, the gap for player amortisation, the annual charge to expense transfer fees over a player’s contract, has reduced from £66m in 2017 to just £12m in 2021: #MUFC £120m vs #LFC £108m.

Both #MUFC and #LFC have seen operating profits worsen, leading to large losses of around £40m in 2021. However, United’s decline is far more striking, steadily falling from a peak of £87m profit in 2016. Liverpool trended to post small operating profits before COVID struck.

Where #LFC have really outshone #MUFC is in player trading, generating higher profits from player sales every season since 2015. In the last 5 years, Liverpool made £274m profit from this activity, more than three times as much as United’s £81m.

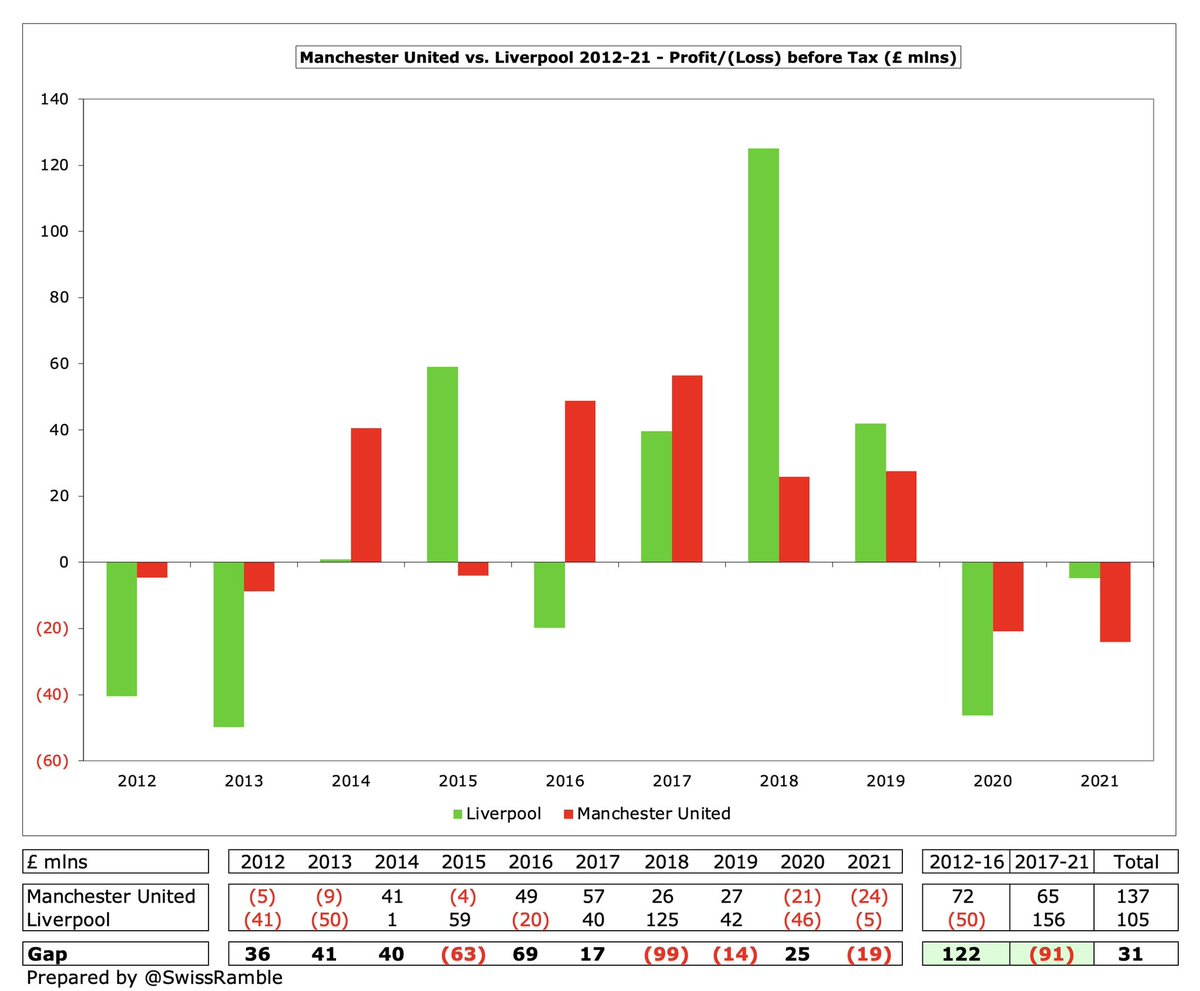
Largely as a result of player sales (and much lower interest payable), #LFC £156m pre-tax profit over the last 5 years is £91m better than #MUFC £65m. This is in stark contrast to the preceding 5-year period, when United’s £72m profit was £122m better than Liverpool’s £50m loss.
#MUFC have had much higher gross transfer spend than #LFC: £1.4 bln over the last 10 years compared to £1.0 bln. Liverpool have only spent more than United three times in the last decade, though two of those came in the last three years (2019 and 2021).

When it comes to net spend, the difference is even more evident with #MUFC £1.0 bln in the last decade being nearly twice as much as #LFC £542m. This is particularly the case in the last 5 years: United £630m vs. Liverpool £318m.

#MUFC gross debt has hardly moved over the last few years, standing at £530m in 2021, while #LFC has risen to £198m. All United’s debt is owed externally, while Liverpool’s is a mixture (external £127m, owner £71m). Owner debt peaked at £110m in 2016 to fund stadium development.

Although #MUFC interest payments have fallen from their peak, they still paid £21m in 2021, compared to #LFC £3m. Over the last 10 years, United have paid £303m, significantly more than Liverpool’s £26m.

#LFC have invested £241m in infrastructure (stadium and training ground) in the last 10 years, mainly in the period between 2015 and 2017, which is a lot more than #MUFC £136m.

#MUFC have paid £133m to their shareholders (largely the Glazers) in the last 10 years, including £123m since 2016 alone. #LFC have paid no dividends to their owners, as is the case with every other club in the Premier League.

In terms of overall owner funding, defined as owner loans plus share capital less dividends, #LFC have received net £110m loans in the last 10 years, while #MUFC have paid £154m (133m dividends & £21m share buyback). No Premier League owners have taken out more than the Glazers.

This analysis shows fairly clearly the progress that #LFC have made off the pitch, largely closing the gap to #MUFC in terms of revenue and wages with better profitability, especially player trading. They have managed this with lower debt and interest payments (and no dividends).
The one area where #MUFC have “outperformed” #LFC is the transfer market, as they have spent much more than their rivals, though not too many would argue that their recruitment has been superior. That said, many Liverpool fans would like to see the club strengthen their squad.
• • •
Missing some Tweet in this thread? You can try to
force a refresh


