Trevor Tombe Profile picture
Sep 13, 2022 15 tweets 6 min read Read on X
Inflation has many concerned, and it's a complex issue. So I'm happy to share some results of work with my colleague, Prof. Sonja Chen: papers.ssrn.com/sol3/papers.cf… Not yet peer-reviewed, but there's some interesting results I'll preview here. 🧵 #cdnecon #cdnpoli
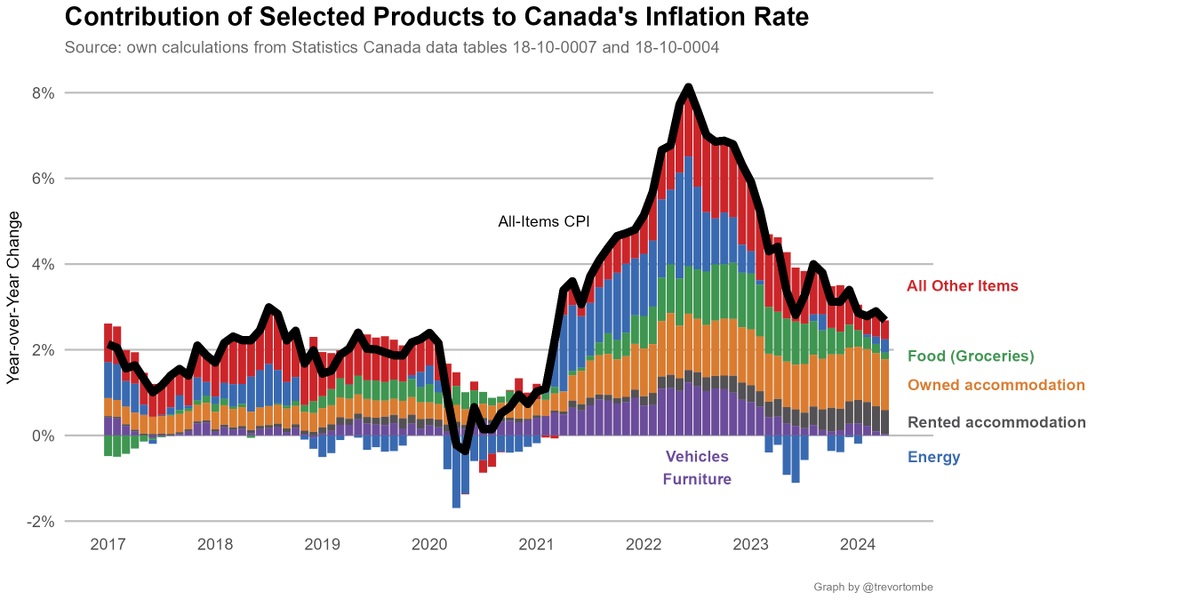
First, it's important to appreciate that rising inflation is accounted for by a few specific items. Had energy and shelter prices, for example, not increased then overall inflation would have been 4.1% in July rather than 7.8%.
More interesting is the spillover effect of energy prices on other goods and services. We find roughly one-quarter of items move up and down strongly with oil prices. And those items account for 60% of the non-energy inflation we're seeing.
This suggests to us that supply-side factors (i.e., the cost of producing goods and services) are potentially more important factor than demand (i.e., higher spending by individuals and businesses).
There's a broad debate about whether the inflation we're seeing is supply-driven or demand-driven.

Luckily, it may be possible to use data to tell the difference between the two. We try to do that in Canada following some recent work by Adam Shapiro: frbsf.org/economic-resea…
The intuition is straightforward. If demand rises, then prices go up *and* quantities purchased goes up. But if prices are rising because of a supply shock, then prices go up but quantity goes *down*. en.wikipedia.org/wiki/Supply_sh…
The trouble is CPI doesn't have good quantity data. But another data source that tracks CPI very closely does! We use that. It's the Canadian version of "PCE Inflation" in the United States. bea.gov/data/personal-… It has price and quantity data for ~100 items.
Details in the paper linked to above if you're interested (and feedback is welcome!). The main results are clear: demand was a big factor early on (see 2021) but over the past few quarters the increases have been largely supply-driven!
And for individual items, here's the top contributors to both demand-driven inflation and supply-driven inflation over the past year. Fuel and food appear to be supply-driven, and large contributors. Home owner costs ("imputed rent") top the demand-side list.
This is important to understand. If true, then much of the underlying cause of recently accelerating inflation don't seem to be due to "money printing" as some might think, or government spending / income support programs.
This doesn't mean there isn't a role for policy -- both fiscal and monetary policy matter. And tighter monetary policy through raising interest rates is what central banks globally are doing now to bring inflation down. Will that be effective? We try to shed light on this too.
Separating items between those that are responsive to interest rates (based on bankofcanada.ca/wp-content/upl…) and items that generally have persistent price changes, we find a potentially encouraging result.
What's this figure mean? It suggests that most of the high inflation is accounted for by items that tend to have just temporary price changes or are sensitive to interest rates (where demand is ~ half the issue).
To be clear, this isn't a prediction about what will happen. But the analysis might be helpful to better understand what's going on today. Especially since much public commentary on inflation isn't as data-driven as a topic like this deserves.
Of course, lots more to understand and note this is not yet peer-reviewed so a referee may catch an error. (Feedback welcome; wonkier the better!)

But hopefully this is an interesting and informative early look. More in the paper: papers.ssrn.com/sol3/papers.cf… !

/fin

• • •

Missing some Tweet in this thread? You can try to force a refresh
 

Keep Current with Trevor Tombe

Trevor Tombe Profile picture

Stay in touch and get notified when new unrolls are available from this author!

Read all threads

This Thread may be Removed Anytime!

PDF

Twitter may remove this content at anytime! Save it as PDF for later use!

Try unrolling a thread yourself!

how to unroll video
  1. Follow @ThreadReaderApp to mention us!

  2. From a Twitter thread mention us with a keyword "unroll"
@threadreaderapp unroll

Practice here first or read more on our help page!

More from @trevortombe

May 21
Today's data: inflation rate falls to 2.7% in April. Would have fallen more, but gasoline pushed the rate up. Shelter remains largest contributor, but pace of increase is falling.

#cdnecon #cdnpoli www150.statcan.gc.ca/n1/daily-quoti…
Image
The key Bank of Canada core measures of inflation have also remained within the target range -- lower than 2% -- over the past 3 months. This is what the bank is looking forward before lowering rates. Image
Here are the contributors to the drop. Most items down, but energy prices offset some of that.

This accounts for *changes* in the CPI annual rate of increase. Alternatively, had energy prices remained flat yoy, then CPI growth would have been 2.4% in April. Image
Read 4 tweets
Feb 20
Today's data: inflation! 🥳 Prices were 2.9%, on average, higher in January than a year earlier. Inflation down from 3.4% in Dec. Biggest contributors to the drop were energy, food, travel. Cell phones offsetting some.


#cdnecon #cdnpoli www150.statcan.gc.ca/n1/daily-quoti…
Image
Looking at the headline rate, shelter is larger contributor. Rent accounts for ~0.5 points of the 2.9, mortgage interest costs ~1.0 points.

Important: note the strong decline in the pace of grocery price growth. Now in line with historical norm. Image
The decline in inflation has also been fairly broad based, with now fewer than half of items seeing a pace of price growth above 3% -- although still a larger share than normal, which is ~0.3-0.4. Image
Read 7 tweets
Jan 16
Today's data: inflation!! 📈 Consumer prices were 3.4% higher in December than one year earlier. That's up from 3.1% in November.

I'll explore some of what's going on. #cdnecon #cdnpoli 🧵 www150.statcan.gc.ca/n1/daily-quoti…
Image
This is higher than last month, true, but it doesn't mean the inflation situation is worsening. I noted this yesterday, saying 3.4% was the number to watch.
This is a *very* important point to keep in mind for the next *several* months. Even if things are completely normal month-by-month, the headline rate won't fall much over the next quarter. Image
Read 9 tweets
Nov 21, 2023
As expected, inflation fell in October. A lot. From 3.8% in September to 3.1% in October. And monthly, adjusted for seasonality, prices were lower in October than Sept.

I'll unpack some more patterns here 🧵 #cdnecon #cdnpoli www150.statcan.gc.ca/n1/daily-quoti…
Image
A big part of the reason is from lower gasoline prices. That's anticipated because oil prices were down. There's a tight connection between energy's contribution to CPI and oil prices (obviously). This has been a consistent story over the past two years. Image
You can see the size of the contribution from energy to the change in inflation since September here 👇 . Basically everything else was a net wash. Image
Read 11 tweets
Nov 11, 2023
Some Alberta Pension Plan proponents are concerned about Albertans paying more in contributions than they receive in benefits. Is this "overcontribution" legitimate? If so, does it imply the CPP is unfair? Would an APP solve it?

Allow me to explain. 🧵🤓 #cdnpoli #ableg #cdnecon
The Government of Alberta regularly cites $60 billion in excess contributions over what has been received in benefits. The report commissioned by the government includes this figure. Red is Alberta. Positive means contributions > benefits. 👇 Image
The data are accurate. You don't even need an actuary. Statistics Canada reports this annually. Total contributions from 1966-2021 amount to approximately $60 billion. Adjusting for inflation provides a clearer perspective. Image
Read 14 tweets
Nov 4, 2023
To better understand this claim, consider an equally true but misleading statement: eliminating the GST would "reduce inflation by 61%"! 😲

Does that mean the GST is inflationary? What about the carbon tax?

I'll try to clarify things 🧵 🤓 #cdnecon #cdnpoli
The GST adds 5% to the cost of purchasing a good or service subject to this tax. Not all items are subject to it, though. I (roughly) estimate that, overall, the GST adds an average of 2.3% for consumer expenditures as a whole. (From here: )www150.statcan.gc.ca/t1/tbl1/en/tv.…
So, eliminating the GST would drop the CPI by 2.3%. Since the latest inflation reading is 3.8%, that would leave us at 1.5% (assuming nothing else changed). And 1.5% is 61% lower than 3.8%.

Simple. But not helpful or informative.
Read 10 tweets

Did Thread Reader help you today?

Support us! We are indie developers!


This site is made by just two indie developers on a laptop doing marketing, support and development! Read more about the story.

Become a Premium Member ($3/month or $30/year) and get exclusive features!

Become Premium

Don't want to be a Premium member but still want to support us?

Make a small donation by buying us coffee ($5) or help with server cost ($10)

Donate via Paypal

Or Donate anonymously using crypto!

Ethereum

0xfe58350B80634f60Fa6Dc149a72b4DFbc17D341E copy

Bitcoin

3ATGMxNzCUFzxpMCHL5sWSt4DVtS8UqXpi copy

Thank you for your support!

Follow Us!

:(