Looking for polar climate visualizations? Start here: 📈📉
+ Arctic sea-ice extent: zacklabe.com/arctic-sea-ice…
+ Arctic sea-ice thickness/volume: zacklabe.com/arctic-sea-ice…
+ Arctic temperatures: zacklabe.com/arctic-tempera…
+ Antarctic sea ice: zacklabe.com/antarctic-sea-…
+ Arctic sea-ice extent: zacklabe.com/arctic-sea-ice…
+ Arctic sea-ice thickness/volume: zacklabe.com/arctic-sea-ice…
+ Arctic temperatures: zacklabe.com/arctic-tempera…
+ Antarctic sea ice: zacklabe.com/antarctic-sea-…
You can also find...
+ Global sea ice: zacklabe.com/global-sea-ice…
+ Archives of Arctic climate rankings (2012-2022): zacklabe.com/archive-2022/
+ Long-term climate change: zacklabe.com/arctic-sea-ice…
+ Arctic climate model projections compared to observations: zacklabe.com/climate-model-…
+ Global sea ice: zacklabe.com/global-sea-ice…
+ Archives of Arctic climate rankings (2012-2022): zacklabe.com/archive-2022/
+ Long-term climate change: zacklabe.com/arctic-sea-ice…
+ Arctic climate model projections compared to observations: zacklabe.com/climate-model-…
To improve transparency of climate data and processing methods, check out my...
+ References for the raw climate data (all free): zacklabe.com/resources-and-…
+ #Python, visualization tools, and other software (all open source and free): zacklabe.com/methods-and-op…
+ References for the raw climate data (all free): zacklabe.com/resources-and-…
+ #Python, visualization tools, and other software (all open source and free): zacklabe.com/methods-and-op…
Other common FAQ (like on anomalies, baselines, internal variability) can be found at zacklabe.com/frequently-ask….
I also feature a monthly #dataviz blog at zacklabe.com/climate-viz-of….
I will use this thread to provides updates on future website additions. Thanks for following! 🙂
I also feature a monthly #dataviz blog at zacklabe.com/climate-viz-of….
I will use this thread to provides updates on future website additions. Thanks for following! 🙂
(Yes, you are welcome to share any of the graphics.)
(You can click on each visualization to enlarge and/or download a higher resolution copy.)
(You can click on each visualization to enlarge and/or download a higher resolution copy.)
I've added a new sea ice reconstruction to my polar climate change visuals page: zacklabe.com/arctic-sea-ice…. This reconstruction is from @kbrenWx et al. (2020, agupubs.onlinelibrary.wiley.com/doi/10.1029/20…) over the period of 1850 to 2018 (annual mean data). Once again, the trend is clear. 

I've added a list to some of my favorite (free) sources for weather forecast models and specialized analysis: zacklabe.com/resources-and-…
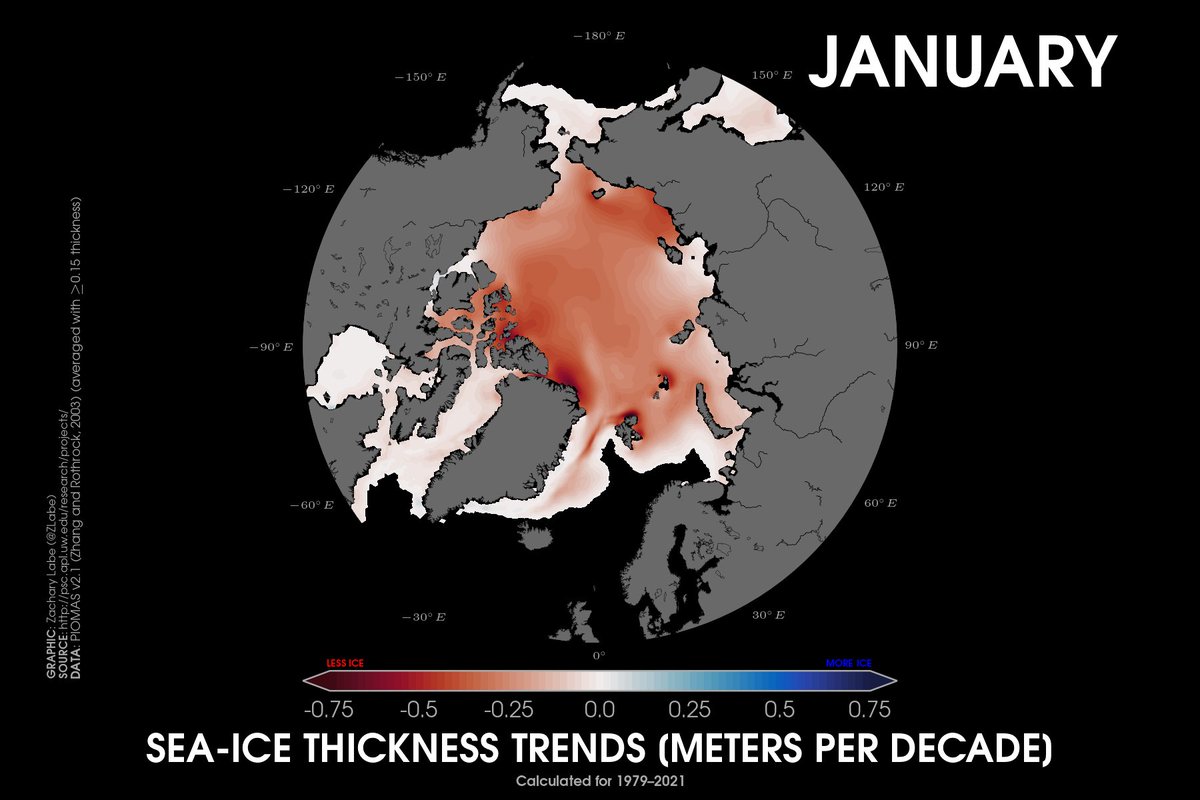
I've created a new visualization to better compare the dramatic losses of #Arctic sea ice volume at the annual minimum and annual maximum times of year. I'll update this seasonally at: zacklabe.com/arctic-sea-ice….

I've added a new page on my website to help organize the visualizations for tracking various climate change indicators. Some of these figures will be updated monthly (or annually). Again, you can click on each graphic to enlarge/download.
Follow along at zacklabe.com/climate-change…
Follow along at zacklabe.com/climate-change…
I've added two new visualizations to my climate change indicators page: zacklabe.com/climate-change…
📈 ocean heat content (will be updated annual)
📈 sea level rise anomalies (updated as available)
📈 ocean heat content (will be updated annual)
📈 sea level rise anomalies (updated as available)


And now here is an additional view of upper ocean heat content changes since 1955: zacklabe.com/climate-change…

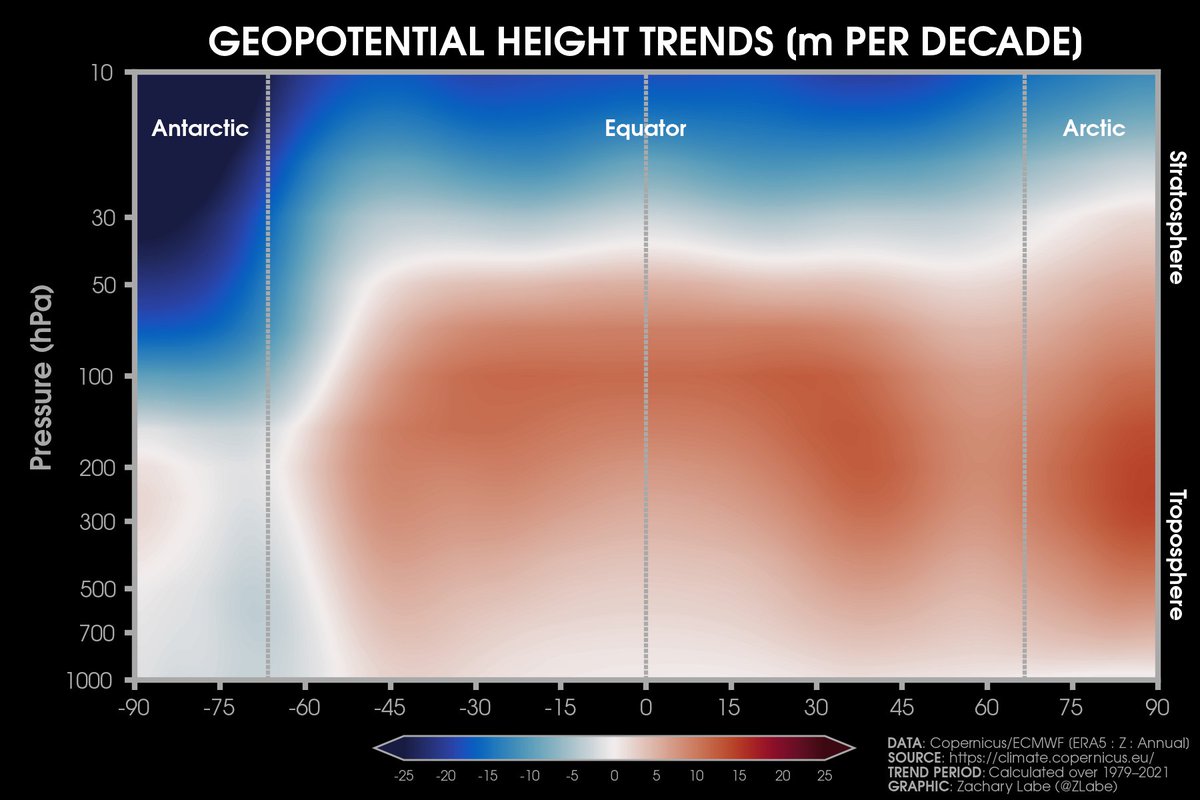
I love looking at vertical cross-sections of climate variables (yes, I probably should get out more). So I decided to add annual trends in zonal-mean temperature and zonal winds to my indicators page: zacklabe.com/climate-change…. Data is from ERA5 in both visuals for 1979-2021.


And here are the corresponding trends in annual mean geopotential heights - will be updated yearly at zacklabe.com/climate-change…. This is consistent with a warming troposphere and cooling stratosphere.
Here's a new page to highlight visualizations of climate seasonality & variability, especially in the #Arctic. This is meant to show our mean climate state and does not focus on recent trends or anomalies. More to come here (e.g., polar vortex, jet)!
➡️ zacklabe.com/arctic-climate…
➡️ zacklabe.com/arctic-climate…
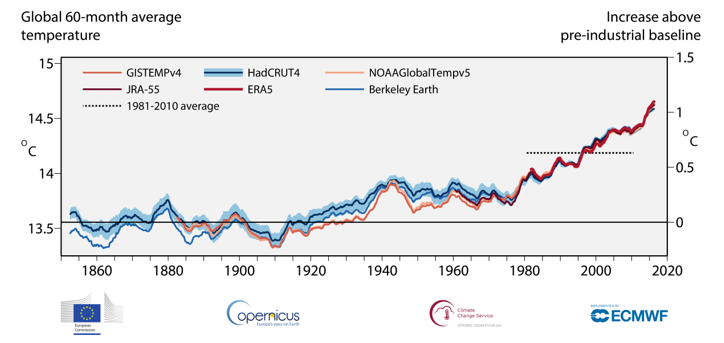
Like I've said before, I think it's very important to stress that land temperatures are warming significantly faster than the global average. So, I decided to create a visualization to track this relative to pre-industrial levels.
Follow along monthly at zacklabe.com/climate-change….
Follow along monthly at zacklabe.com/climate-change….

Here's a new climate change indicator showing the cumulative loss of mass for reference glaciers around the world for every year from 1950 to 2021...
Now updated annually at zacklabe.com/climate-change….
Now updated annually at zacklabe.com/climate-change….

I've added a longer perspective for carbon dioxide (CO₂) on my climate change indicators page - data from 1600 to 2021...
+ I'll update this each year at zacklabe.com/climate-change….
+ I'll update this each year at zacklabe.com/climate-change….

Here's a new climate change indicator plot showing the trend in yearly temperatures over land areas for the last several decades...
+ This graphic will be updated annually at zacklabe.com/climate-change…
+ This graphic will be updated annually at zacklabe.com/climate-change…

• • •
Missing some Tweet in this thread? You can try to
force a refresh