High win rate moving average patterns that will earn you millions in #crypto and #stocks
Master these 2 often repeated Moving Average patterns to print millions on #altcoins like $APTS, $MATIC, $SOL, $GMT, $SHIB
Part 3 followup on my Moving Average series 👇🏽
Master these 2 often repeated Moving Average patterns to print millions on #altcoins like $APTS, $MATIC, $SOL, $GMT, $SHIB
Part 3 followup on my Moving Average series 👇🏽
I have been delaying with finishing this guide for days.
Most people won't ever get to use advanced techniques so I decided to make it simple.
Most people won't ever get to use advanced techniques so I decided to make it simple.
This is a part 3 followup on my Moving Average series, if you haven’t read part 1 and 2 please do so here:
Part 1 (spotting trend and trend reversals):
Part 2 (Using Moving Averages as key levels of support/resistance):
Part 1 (spotting trend and trend reversals):
https://twitter.com/MacnBTC/status/1565048945688170500
Part 2 (Using Moving Averages as key levels of support/resistance):
https://twitter.com/MacnBTC/status/1569732990112079873
I will show you 2 easy high win rate patterns where MAs combined with basic TA techniques can earn us money
Let’s jump right in 👇🏽
Let’s jump right in 👇🏽
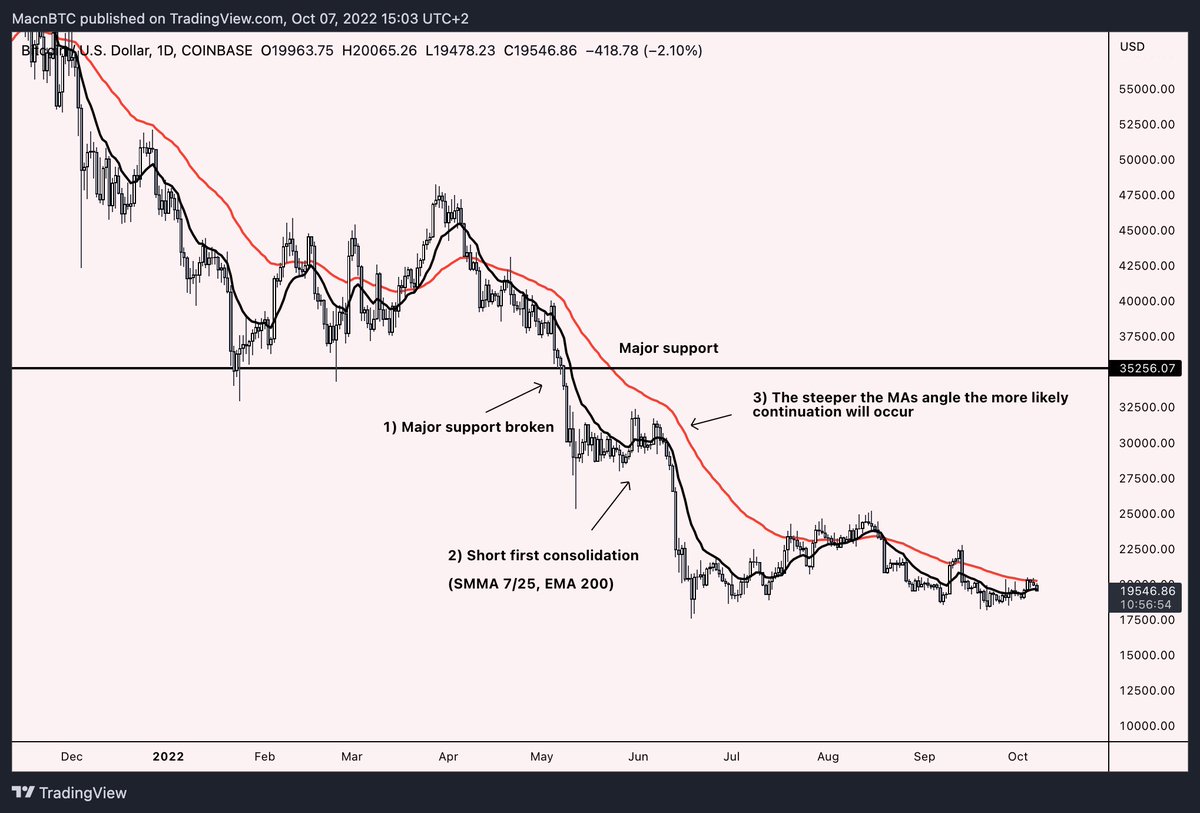
1) Shorting first consolidation after a support is broken and MA trend is reversed
When major support levels are broken and low timeframe MAs start to reverse (push downwards on price) we can often short the first consolidation after a breakdown with high win rate.
When major support levels are broken and low timeframe MAs start to reverse (push downwards on price) we can often short the first consolidation after a breakdown with high win rate.
Example 1a) shows Bitcoin losing major support, we wait for the consolidation after the breakdown then short just before MAs follow up to price - continuation of breakdown occurs. 
Example 1b) DOT loses support level with low timeframe MAs pushing down on price. We wait for the initial consolidation after the breakdown and short it right before MAs follow up.
The steeper the angle of the MAs following on price the more chance it has to break down further
The steeper the angle of the MAs following on price the more chance it has to break down further

If the MAs following down on price are becoming flat it is not a good idea to short - this is why I only teach you to short the initial breakdown after a support is broken/trend is reversing.
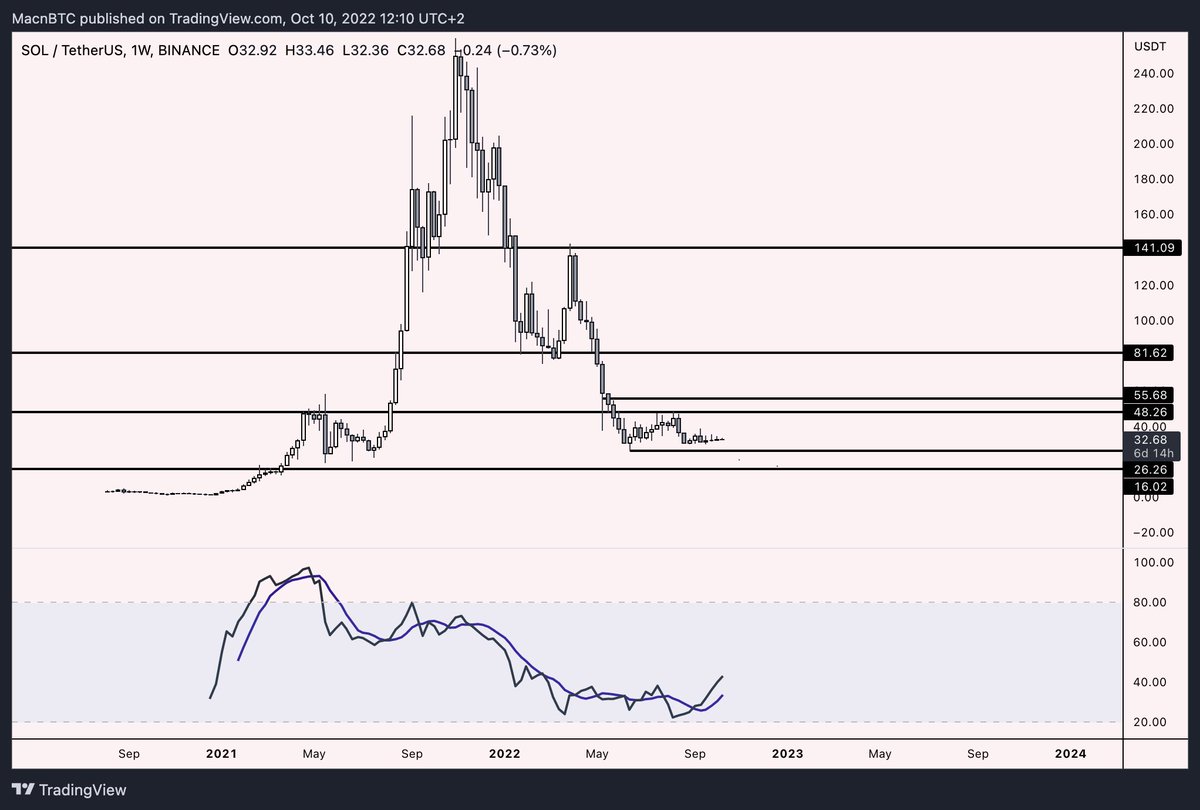
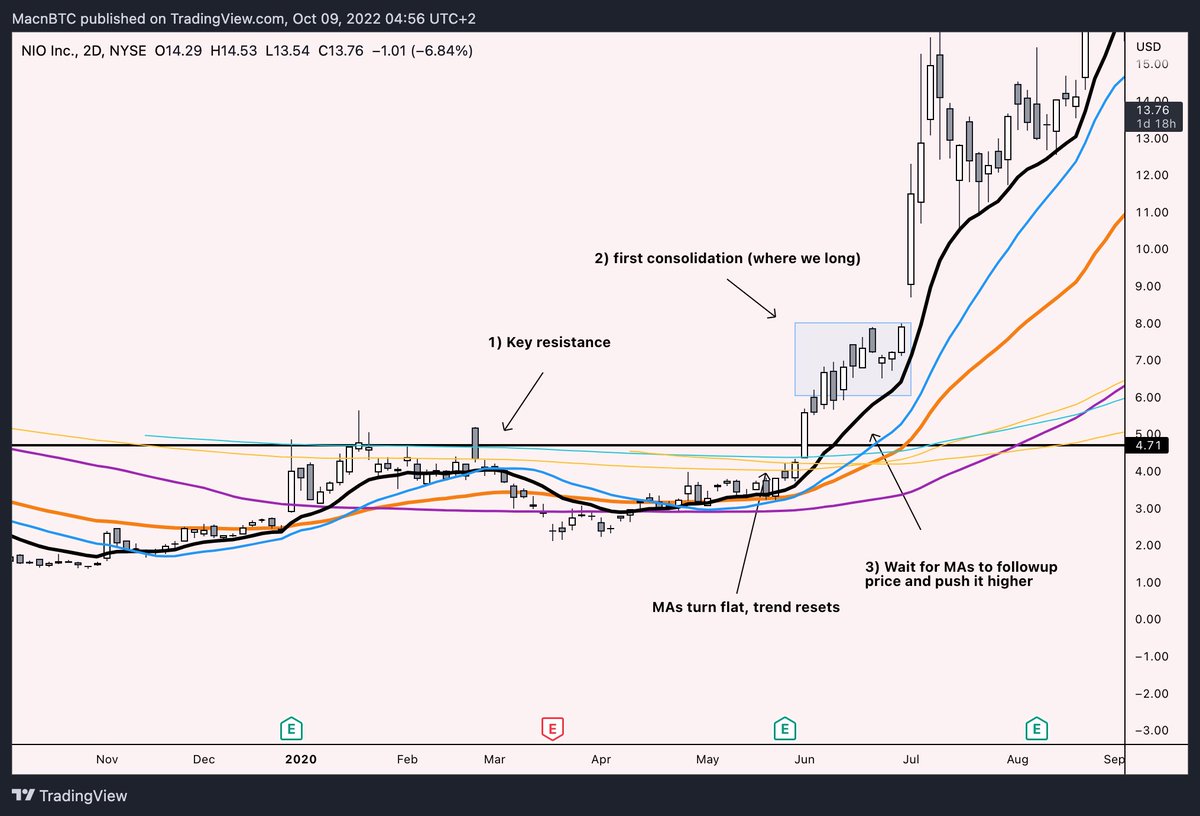
2) Longing the first breakout of a key resistance level (if low timeframes MAs are flat/retaken)
We can often long the first consolidation of a major resistance breakout given
- LTF MAs are flat
- HTF MAs aren't pushing down at a too steep angle/there is a gap
We can often long the first consolidation of a major resistance breakout given
- LTF MAs are flat
- HTF MAs aren't pushing down at a too steep angle/there is a gap
Example 2a)
Price breaks key resistance & all MAs on similar timeframes look good to reverse OR there is a gap between low timeframe MAs and price👇🏽
We can then long the first consolidation after a breakout and wait for MAs to follow up price and push it higher (continuation)
Price breaks key resistance & all MAs on similar timeframes look good to reverse OR there is a gap between low timeframe MAs and price👇🏽
We can then long the first consolidation after a breakout and wait for MAs to follow up price and push it higher (continuation)
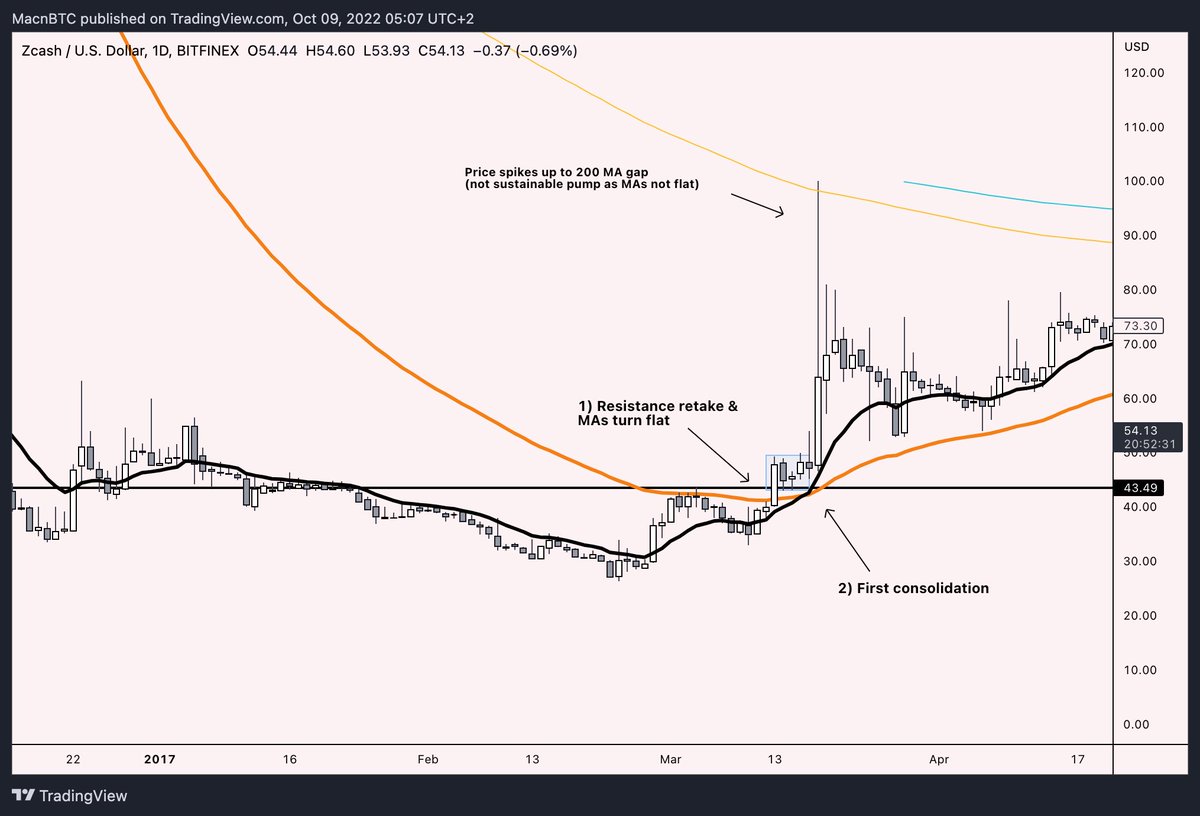
Example 2b) Key resistance break & MAs on daily turn flat and retaken -> We long first consolidation. Price spikes up to 1D MA200
(extra: if we studied MA theory we see that the MA 200 is not ready to reverse - pump isn't be sustainable we could have also shorted that wick)
(extra: if we studied MA theory we see that the MA 200 is not ready to reverse - pump isn't be sustainable we could have also shorted that wick)
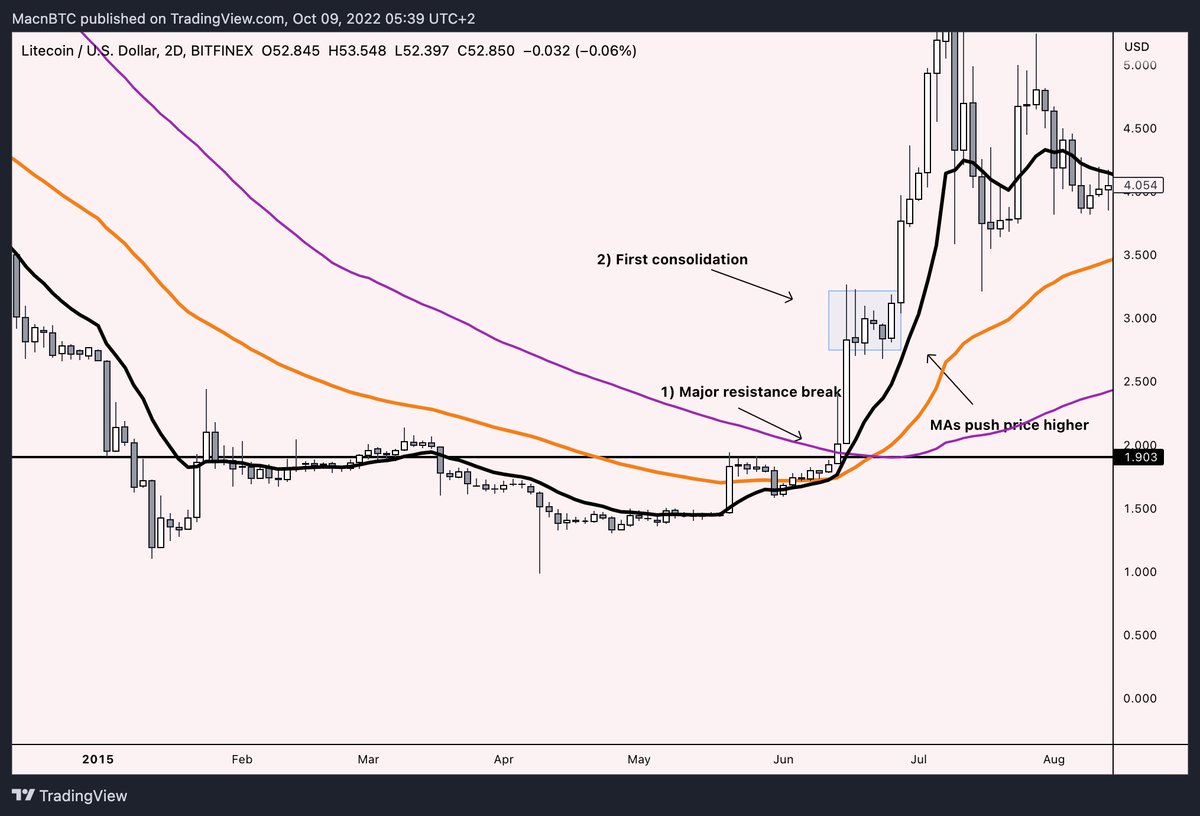
Example 2c) Again, breakout of key resistance with MAs turning flat & retaken.
We long the first consolidation and wait for MAs to follow up and ignite consolidation 🔥
We long the first consolidation and wait for MAs to follow up and ignite consolidation 🔥
With this knowledge we can set alerts on assets that notify us of breakouts/breakdowns of key levels.
and enter on the first consolidation.
and enter on the first consolidation.
That’s it!
1) Follow @macnbtc
2) Join my Telegram: t.me/teammacnbtc
Going to keep the momentum going and push out new guides in the next days.
Don't miss it 🔔
1) Follow @macnbtc
2) Join my Telegram: t.me/teammacnbtc
Going to keep the momentum going and push out new guides in the next days.
Don't miss it 🔔

• • •
Missing some Tweet in this thread? You can try to
force a refresh