Look, Honestly what I think about the current market situation #NIFTY & # SENSEX >> thread [1/n] 👇
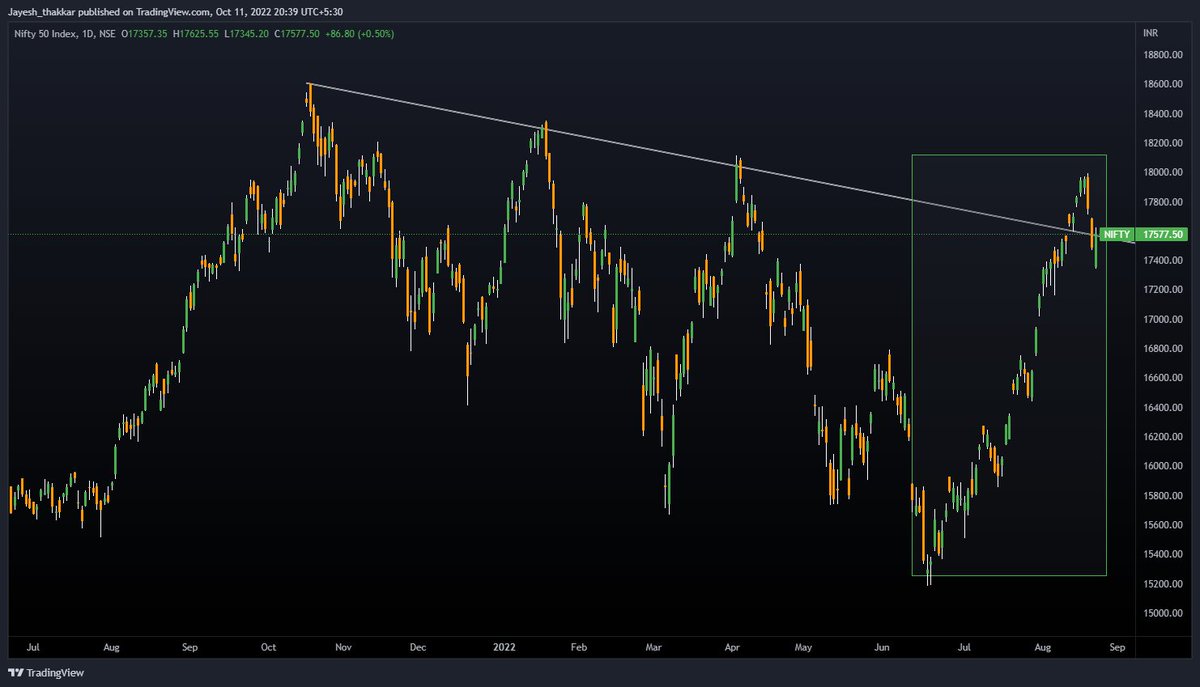
mostly in history, I saw every time #USDINR price come upside and the market also show correction on big timeframes same time, #usdinr continuously going upside after July but our index was also going upside in June, July, and Aug after 15,183 Low
#NIFTY sustained upside to this trendline for more than two to three weeks, which was a sign of continuing bull run, and targets of 19k and 20k, in fact, all TV anchors were giving long-term and shorterm trades, all big channels, and Twitter handles were started posting 20k chart
After Trapping all Buyers, shorterm, and longterm trade we are again in a falling market, below the trendline in the weekly chart, market making big red candles and small green candles, which clearly shows the direction to the downside
now if you see all other global indices now, they already correct a lot from their highs, sharing #DJI monthly chart, if you check it corrected and went below 0.618 in trend base fibo extension, see another chart S&P 500 dropped below 0.618 & near to 0.5, using trend fib Exten.
not only DJI & S&P500 but also if you see another major index Like NASDAQ, DAX, NIKKEI, and HSI (HANG SENG ) all are falling and below 0.61 levels at least, if you noticed Hengseng is dropping badly
Every day we see headlines from the last few months & all experts are also saying the same
Now let me show you the Indian index #Nifty & #Sensex with trend-based Febo Extention below
Nifty is not below 0.618 levels & not even touched
so i can say we have to drop below 0.618 ?
so now the question is why we are not falling?
because DII FII not removing money?
because India is to a strong economy?
are we manipulated?
we are yet to drop badly?
recession is coming? if yes then when it will be the right time to buy ?
what is a clear direction for the market
share your views, I shared Technical charts data, if you have more data can discuss it over here, also if I am wrong let me know.
and Retweet if you liked it 🙂 Thanks for Reading
Here's an analysis of the key points and potential implications of the Interim Budget 2024-25 presented by Finance Minister Nirmala Sitharaman:
#Budget2024 thread 🧵👇[1/11]
Focus on Inclusive Growth and Development:
The budget emphasizes inclusivity, aiming to improve living standards for all sections of society, particularly women, youth, farmers, and the underprivileged.
Schemes like PM Kisan, PM Mudra Yojana, and free ration for 80 crore people reflect this focus.[2/11]
Infrastructure Development and Investment:
The budget prioritizes infrastructure development with an 11.1% increase in capital expenditure outlay, aiming to boost employment and economic growth.
Initiatives like three major economic railway corridors, port connectivity corridors, and metro expansion aim to improve logistics and urban infrastructure.[3/11]
Double Candlestick Pattern एक महत्वपूर्ण और Trade Reversal या Continuation pattern है ,यह पैटर्न दो कैंडलस्टिक से बना है
आइए नीचे दिए गए Tweets में इन Pattern के प्रकार को समझें
Content पसंद है, तो Like, Retweet करें और Bookmark करना न भूलें, Follow करे
Thread 🧵 [1/11]
Tweezer Tops: जब दो Candlesticks समान High प्रदर्शित करते हैं तो ये Pattern Uptrend में Possible Reversal का संकेत देते हैं। Traders इसे ऐसे moment के रूप में देखते हैं जहां Buyers या Bulls नियंत्रण खो रहे हैं। यह एक Uptrend के Reversal को दिखाता है
[2/11]
Tweezer Bottoms इसके Opposite, Tweezer Bottoms Downtrend के निचले भाग में तेजी से Reversal का संकेत देते हैं। समान Low वाली दो Candlesticks की Pattern बन्ना Market की धारणा में Possible Change का संकेत देती है, जो Traders का ध्यान आकर्षित करती है।
Traders इसे ऐसे moment के रूप में देखते हैं जहां Sellers या Bears नियंत्रण खो रहे हैं। यह एक Downtrend के Reversal को दिखाता है
[3/11]
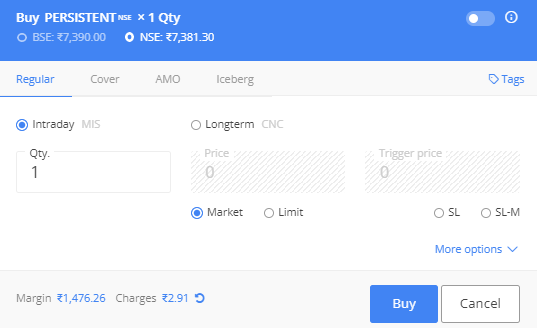
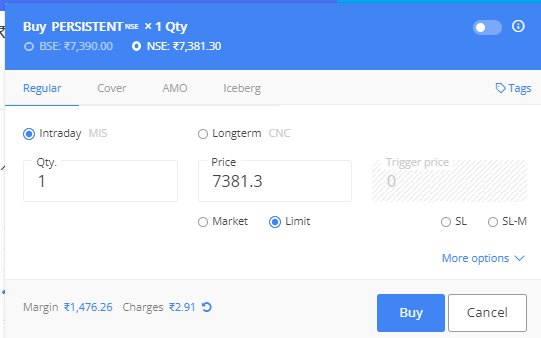
Intraday Trading के दौरान आप किस Order Type का use करते हैं?
बहुत से लोग Zerodha Order में Common गलतियाँ करते हैं
आइए Zerodha पर प्रत्येक Order Type समझें:
अगर आपको ट्वीट पसंद आया, तो Please Retweet करें, Like करें और Bookmark करना न भूलें
Thread🧵 [1/9]
Market Order (MO):
Use: यह Order Market में Best Available Price पर तुरंत Execution करता है।
इस Order को डालने के बाद, यह Order Book में Pending दिखाए बिना सीधे Execute होगा
याद रखें कि Market Order ही बाजार में Price Change का कारण हैं
Example : आप मौजूदा Market Price पर किसी Stock को तुरंत Buy या Sell करना चाहते हैं।
तो इस Order का उपयोग करें
[2/9]
Limit Order (LO):
Use : वह Price Fix करें जिस पर आप Stock Buy या Sell करना चाहते हैं।
इसके अनुसार Limit Order लगाओ , Order Execute होने तक Pending दिखेगा
जब तक Order Execute नहीं हो जाता और Stock आपकी Price पर नहीं आ जाता, Order Pending दिखाएगा, यह आपकी Price आने के बाद ही Execute होगा।
Example: आप एक Stock Buy के इच्छुक हैं, लेकिन तभी जब यह आपके द्वारा Fix ki specific कम Price पर पहुंचता है, तो इस Order का उपयोग करें
[3/9]
DOJI CANDLE तब होता है जब किसी Candle की Open और Close price बहुत करीब या लगभग Same होती हैं, यह एक Candlestick बनाता है जो Cross या Plus (+) Sign जैसा दिखता है।
आइए हर प्रकार के DOJI Pattern के बारे में अच्छी तरह से जानें:
अगर आपको मेरा Tweet पसंद आया तो Like और Retweet करना न भूलें, Bookmark भी करें 🙂💚
THREAD [1/7]
Classic Doji:
Classic Doji में Long और Down Shadow के साथ एक Small या नके बराबर Body है, जो दिखाता है कि Open और Close Price बहुत करीब हैं। यह एक Cross या Plus(+) चिह्न जैसा दिखता है।
Classic Doji Market के indecision की State का सुझाव देता है। Market की Possible Direction निर्धारित करने के लिए Trader अक्सर आसपास के Candlesticks patterns या Indicators से Confirmation की तलाश करते हैं।
[2/7]
Dragonfly Doji:
Dragonfly Doji की निचली Shadow लंबी है और ऊपरी Shadow नहीं है, जो इसे "T" आकार देती है। यह दिखाता है कि Trading के दौरान Price में गिरावट आई, लेकिन High के करीब बंद हुई।
इस Pattern को अक्सर Bullish Reversal के रूप में देखा जाता है, खासकर अगर यह Downtrend के बाद दिखाई देता है। यह दिखाता है कि Sellers ने कीमतें कम कर दीं, लेकिन Buyers आगे आ गए, जिससे Trend Reversal हुआ।
[3/7]
Marubozu एक candlestick पैटर्न है जिसमें Long Body होती है और ऊपर और नीचे के Shadows कम होती हैं।
मैंने नीचे दिए गए Tweets में सभी प्रकार की Marubozu Candlesticks बटाई हैं
Retweet करें, Like करें या Book Mark करें 🙂💚
Thread [1/5]
Small Shadows Marubozu:
- इसमें एक बड़ी Red or Green Candle होती है जिसमें छोटी ऊपरी और निचली Shadow होती हैं।
- यह एक Bullish Pattern है, खासकर अगली कुछ दिनों में यदि Price नीचे की Shadow के ऊपर रहता है।
- नीचे की Shadow एक Support Level के रूप में काम करती है
- Sell Side में भी इस्की विपरीत Opposite Pattern काम करता है
[2/5]
No Shadows Marubozu:
- यह सबसे Bullish pattern है, जो एक Strong Uptrend की सूचना देता है।
- दिन का Price नीचे से Open है और ऊपर से Close होता है, बीच की कोई Range नहीं होती है।
- Traders अक्सर इस पैटर्न को एक Strong Uptrend के Entry Signal के रूप में देखते हैं
- Sell Side में भी इस्की विपरीत Opposite Pattern काम करता है
[3/5]