(1/n) A fun and practical idea for an R package: a #ggplot2 extension to modify plots so they adhere to an organization’s visual identity 📊📈📉⬇️
(2/n) A visual identity allows an entity to be instantly recognized. Made up of their logo, typography, and colors, it can be applied when creating external or internal communications. For example, here’s the visual building blocks of my alma mater @UBC: bit.ly/3EN0oNs Left: a sequential palette made up of 7 colors. Right: a lis
@UBC (3/n) My first crack at package development was during my master's studies with @UBCMDS. My classmates and I created a #ggplot2 extension to allow users to change the appearance of plots based on the visual identities of different Canadian universities: bit.ly/3VHssIe
@UBC @UBCMDS (4/n) I ended up being able to apply these skills right away after graduating (yay). At my job, I found myself creating another package to help standardize the color palette, gridlines, text alignment, etc. of plots made to help interpret healthcare utilization data.
@UBC @UBCMDS (5/n) I think the 📦 ended up being a useful tool: having access to something that quickly took care aesthetic components meant that analysts could spend more time identifying trends in the data rather than tweaking their code to get the plot to look right *chef's kiss*
@UBC @UBCMDS (6/n) Even if there isn’t a color palette that you need to adhere to in your day-to-day work, maybe you always find yourself modifying the same components of a ggplot2 theme. Why not wrap that code chunk you got (along with some other helper functions) into a package?
@UBC @UBCMDS (7/7) Closing this thread with some relevant resources:

💡 What you can modify in ggplot2: ggplot2.tidyverse.org/reference/them…

💡 Extra themes for ggplot2: github.com/jrnold/ggthemes

What are your favourite ggplot2 extensions?

• • •

Missing some Tweet in this thread? You can try to force a refresh
 

Keep Current with We are R-Ladies

We are R-Ladies Profile picture

Stay in touch and get notified when new unrolls are available from this author!

Read all threads

This Thread may be Removed Anytime!

PDF

Twitter may remove this content at anytime! Save it as PDF for later use!

Try unrolling a thread yourself!

how to unroll video
  1. Follow @ThreadReaderApp to mention us!

  2. From a Twitter thread mention us with a keyword "unroll"
@threadreaderapp unroll

Practice here first or read more on our help page!

More from @WeAreRLadies

Oct 19
(1/n) Since Halloween is just around the corner, let's talk about something spooky: presentations with LIVE CODING 🎃👻😱. To prepare for a 2-hour virtual workshop on package development, I came up with a system to help me stay organized.

Here's what helped⬇️
(2/n) First, what is it about live coding that makes it tricky? IMO it’s the amount of context switching. You need to keep the audience engaged while juggling an array of different apps (e.g. web browser, IDE, terminal). More apps = more unexpected things possibly happening.
(3/n) I decided to base my workshop on Chapter 2 of the R Packages book. The book did *a lot* of the heavy lifting for me; I used the section headings to outline my lesson plan. I also made sure to set aside some time for a break in the middle and a discussion at the end.
Read 8 tweets
Oct 18
(1/n) Think that your team's workflow could benefit from a custom R package but don't know where to start?

Here's a list of steps that helped me when I was embarking on my package development journey at my previous workplace ⬇️
(2/n) First, identify your team's needs. Are there any pain points that could be alleviate with code?

I chose to send out a questionnaire to formulate a team-wide wish list of functions they'd like to see in the communal toolbox 🧰

For each function, I asked for the following:
(3/n)
1️⃣ Description and purpose
2️⃣ Does a prototype exist? If it is available on a shared drive (or something similar), where can I find it 🔦 (e.g. path, line number)?
3️⃣ Expected input(s) and data type(s)
4️⃣ Expected output(s) and data type(s)
5️⃣ Expected frequency of use
Read 6 tweets
Oct 18
(1/n) Last year, I led workshops on package development with the help of @RLadiesVan and @RLadiesSeattle. I often find it helpful learning why a tool is useful before diving into how to use it, so I began each workshop by motivating why you might want to try creating a package:
@RLadiesVan @RLadiesSeattle (2/n) I’ll write a few lines of code to accomplish a specific task. Later, I'll often find that the code chunk is rather applicable to other situations. I might copy and paste the relevant lines of code and repurpose it by changing a few characters here and there.
@RLadiesVan @RLadiesSeattle (3/n) If I find myself having to do this multiple times (>2), it's a sign for me to wrap the code into a function. If I ever need to change its behavior, I'll just have to edit the function definition. This sure beats trying to find and amend all instances of the copied code!
Read 7 tweets
Oct 15
(1/n) Getting data can be difficult when trying to work on an open source project for your blog/portfolio/fun and to practice your R skills! Here are some resources to get started:

kaggle.com/datasets
data.gov

What are your go to sources?

#rstats #data
(2/n) You can also go the API route to export your data from services you may use (e.g. Spotify, Strava)

rviews.rstudio.com/2021/11/22/str…
rcharlie.com/spotifyr/

#rstats #data
(3/n) TwitteR! rdocumentation.org/packages/twitt…

cran.r-project.org/web/packages/g…

When using, be mindful that you may only be able to pull a sample of results using the free tier and analysis results may not be generalizable.

#rstats
Read 5 tweets
Oct 11
(1/n) All about Shiny. My go to approach for building shiny apps is finding an example I like, going to the github to review the code, and retrofitting it for my use case (w/ credits!).

shiny.rstudio.com/gallery/
(2/n) I learned this approach via an online course where we deployed models via Shiny to show performance. It was daunting at first and my first foray into building an application.

If you are just getting into Shiny and feel overwhelmed, you've got this & keep at it.
(3/n) Version control & Peer review: Something I like about code based dashboards (vs. low/no code solutions) is that it version control becomes possible via git, and dashboards that require complicated calculations are more visible/transparent in a single script.
Read 10 tweets
Oct 10
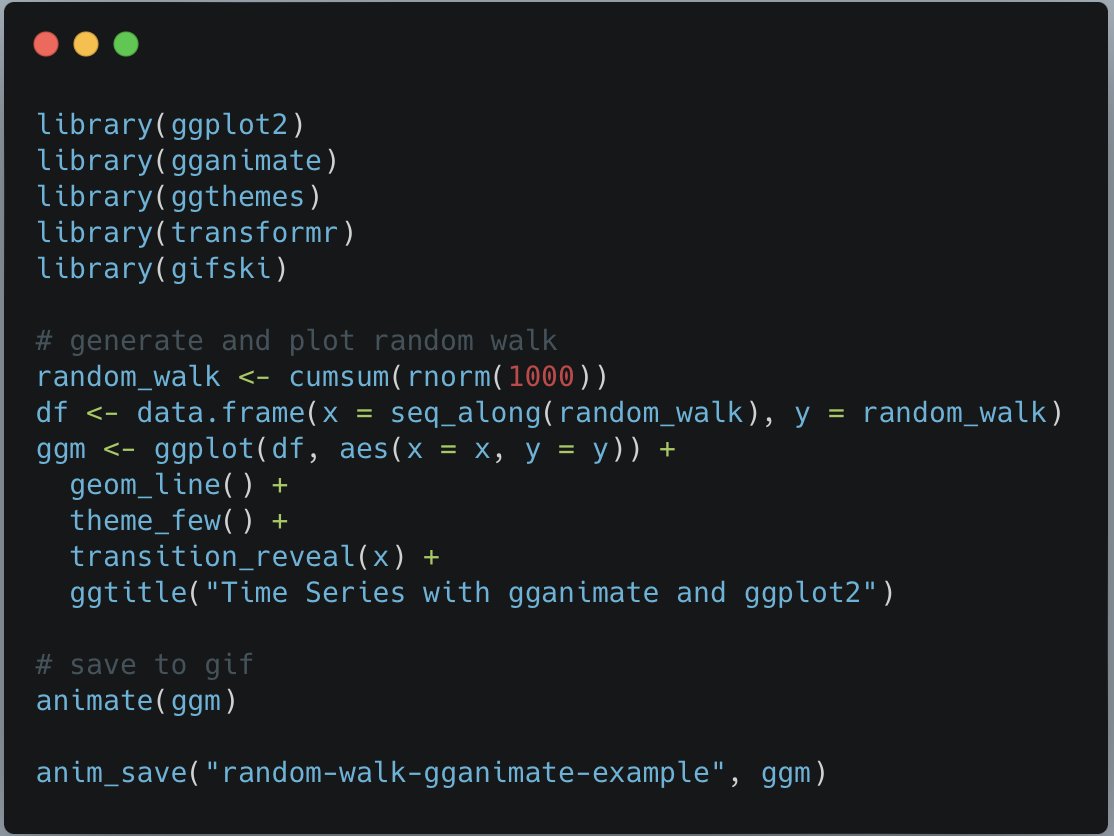
(1/n) I love telling stories with data and I have recently discovered #gganimate as a way to take my #dataviz to the next level.

gganimate.com
Here is some sample code to generate a random walk, create a line plot, and layer in the animation. I love how it's simple to layer within the #ggplot2 framework. Image
(3/n) Here is the resulting plot! using the `transition_reveal()` it keeps the previous points on the graph, but it is highly configurable. For example, I could use `transition_time()` or `transition_state()` to only show the point being added.
Read 7 tweets

Did Thread Reader help you today?

Support us! We are indie developers!


This site is made by just two indie developers on a laptop doing marketing, support and development! Read more about the story.

Become a Premium Member ($3/month or $30/year) and get exclusive features!

Become Premium

Don't want to be a Premium member but still want to support us?

Make a small donation by buying us coffee ($5) or help with server cost ($10)

Donate via Paypal

Or Donate anonymously using crypto!

Ethereum

0xfe58350B80634f60Fa6Dc149a72b4DFbc17D341E copy

Bitcoin

3ATGMxNzCUFzxpMCHL5sWSt4DVtS8UqXpi copy

Thank you for your support!

Follow Us on Twitter!

:(