
🧵 The Global Tanaka Project – Update 3 🌎🌍🌏
This week's update shows a busier globe with a soothing score 🎶, more plane/ship activity, biomes and vegetation, landmarks, volcanoes, a moon and the ISS satellite! Details below... #map #animation #3d
This week's update shows a busier globe with a soothing score 🎶, more plane/ship activity, biomes and vegetation, landmarks, volcanoes, a moon and the ISS satellite! Details below... #map #animation #3d
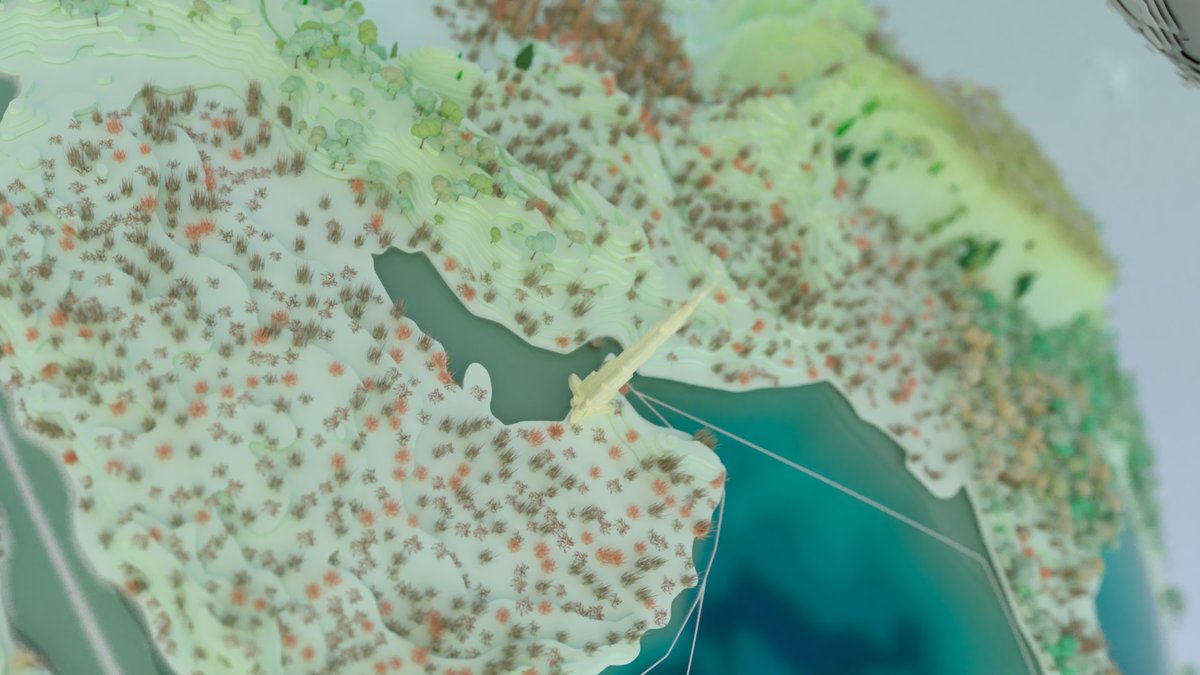
Biomes:
Using data from sciencebase.gov/catalog/item/5… I wanted to create a distinct feel for each ecosystem – this needs work still and I need to source some better low-poly vegetation models but I think it helps to distinguish eco regions.
Using data from sciencebase.gov/catalog/item/5… I wanted to create a distinct feel for each ecosystem – this needs work still and I need to source some better low-poly vegetation models but I think it helps to distinguish eco regions.


Volcanoes:
I love @SonjaKuijpers idea about adding volcanoes and so found some data for volcanoes (volcano.si.edu via ArcGIS Online) with an ‘advisory’ or ‘watch’ threat level, otherwise there are too many! I need to get these animated and integrated properly…
I love @SonjaKuijpers idea about adding volcanoes and so found some data for volcanoes (volcano.si.edu via ArcGIS Online) with an ‘advisory’ or ‘watch’ threat level, otherwise there are too many! I need to get these animated and integrated properly…


Landmarks:
I love the idea of adding in global landmarks so have started compiling a list so the current version is far from exhaustive. They definitely give a ‘Civilization’ vibe to the global map!
I love the idea of adding in global landmarks so have started compiling a list so the current version is far from exhaustive. They definitely give a ‘Civilization’ vibe to the global map!


Moon / ISS:
@mxfh suggested adding a moon, I loved the idea of a small Tanaka moon - totally needs sense checking etc but proof of concept is there. I’ve also added an orbiting ISS, just because!
@mxfh suggested adding a moon, I loved the idea of a small Tanaka moon - totally needs sense checking etc but proof of concept is there. I’ve also added an orbiting ISS, just because!


Next steps:
I want to keep building on this map but my bigger question is whether it should exist as two versions; human vs environmental?
I want to look into global animal migrations next as well as squash a ton of niggly issues in the current version! Watch this space... #map
I want to keep building on this map but my bigger question is whether it should exist as two versions; human vs environmental?
I want to look into global animal migrations next as well as squash a ton of niggly issues in the current version! Watch this space... #map

• • •
Missing some Tweet in this thread? You can try to
force a refresh


