The Actuaries Institute COVID-19 Mortality Working group has just released our new analysis of excess mortality using detailed data to 31 July 2022.
TLDR: Another huge excess in July.
#COVID19Aus #ExcessMortality
You can find the full write-up here...
actuaries.digital/2022/11/03/cov…
TLDR: Another huge excess in July.
#COVID19Aus #ExcessMortality
You can find the full write-up here...
actuaries.digital/2022/11/03/cov…
Note we measure excess deaths relative to pre-pandemic expectations of mortality, including allowance for continuation of mortality improvement (around 1.5-2% pa).
Our methodology also allows for changes in the size and age mix of the population.
Our methodology also allows for changes in the size and age mix of the population.
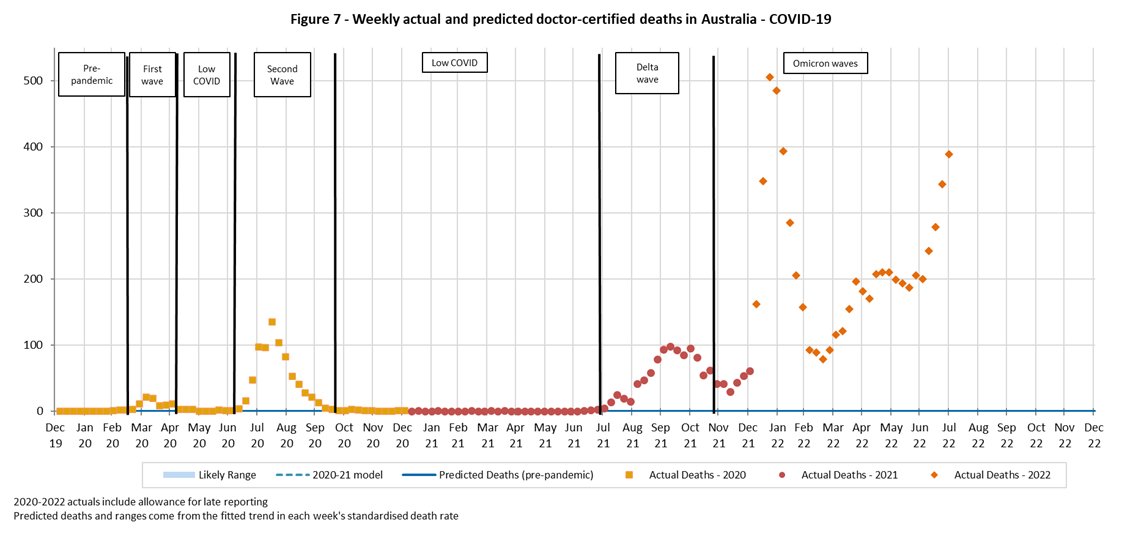
Actual deaths (orange diamonds) in July were again very high, and well above the 95% prediction interval (blue shading). 

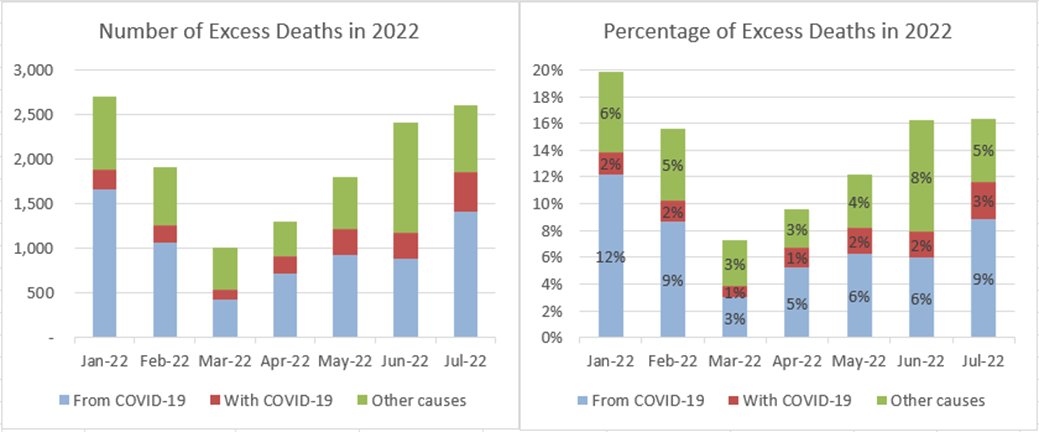
We are measuring 16% excess for the month of July, or 2,600 additional deaths. About 1,400 of those deaths were due to COVID.

For the first 7 months of 2022, we are measuring the excess at 14%, or almost 14,000 more deaths than predicted.
Half of these are due to COVID.
Another 1,700 had COVID as a contributory cause.
Half of these are due to COVID.
Another 1,700 had COVID as a contributory cause.

Here is a breakdown into deaths from COVID, with COVID and other causes by month.
For completeness, here is the same table for 2021 and 2020.

Here's the COVID graph by week. Based on surveillance reporting, I expect the month of August will also have an average of around 300 deaths per week.
Here's influenza. An early peak, and well below the bad flu seasons of 2017 and 2019.
Deaths from other respiratory causes are lower than predicted.
Deaths from other respiratory causes are lower than predicted.

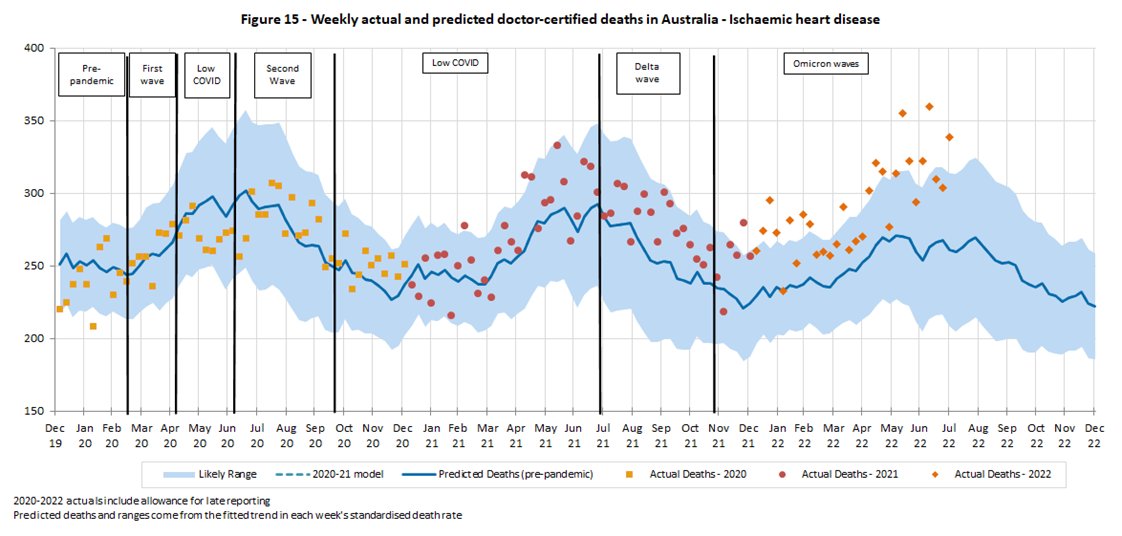
Non-COVID, non-respiratory deaths. Up massively in 2022.

It is not due to cancer.

Ischaemic heart disease is a key driver.
As are "other" diseases - this is a catch-all group of everything not specifically reported on by the ABS.

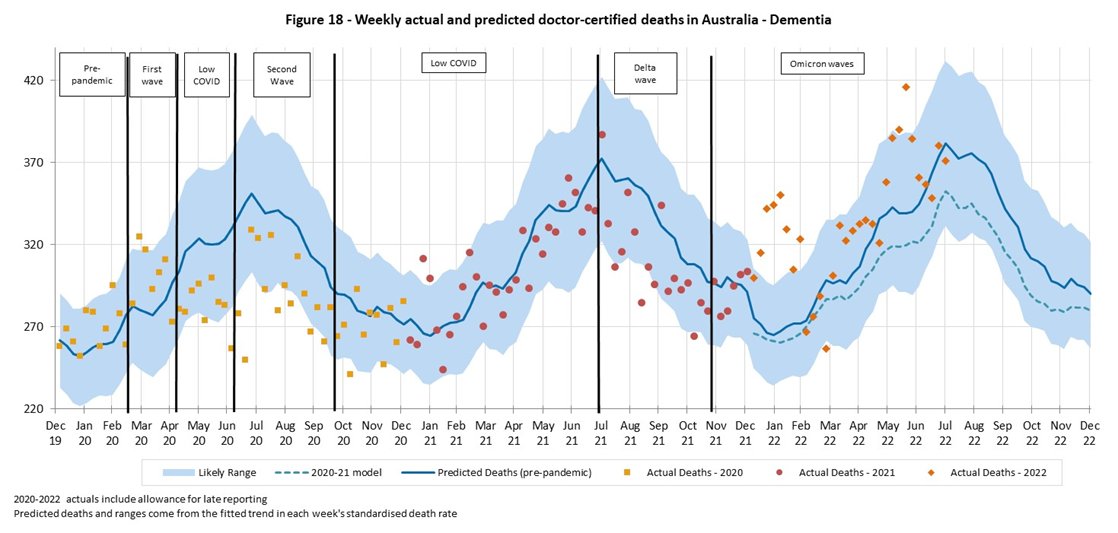
While dementia deaths are up overall in the 7 months, most of this excess was in Jan/Feb.
What about beyond 31 July?
Surveillance deaths peaked in Aug, with Sept much lower and Oct lower again. We estimate excess mortality due to COVID only of 9%, 6% and 2% respectively.
Given the experience so far in 2022, we expect total excess mortality will be higher than this.
Surveillance deaths peaked in Aug, with Sept much lower and Oct lower again. We estimate excess mortality due to COVID only of 9%, 6% and 2% respectively.
Given the experience so far in 2022, we expect total excess mortality will be higher than this.

This graph shows the mortality rate for each year expressed relative to 2019, and allows for our aging population.
Noting we had a pre-pandemic trend of mortality improvement of 1.5-2% pa, the first 7 months of 2022 is well above any other year shown. Terrible.
Noting we had a pre-pandemic trend of mortality improvement of 1.5-2% pa, the first 7 months of 2022 is well above any other year shown. Terrible.

The Working Group is currently preparing some analysis by age band/gender, and I am hoping we will be able to publish next week.
The end. Any questions?
The end. Any questions?
• • •
Missing some Tweet in this thread? You can try to
force a refresh