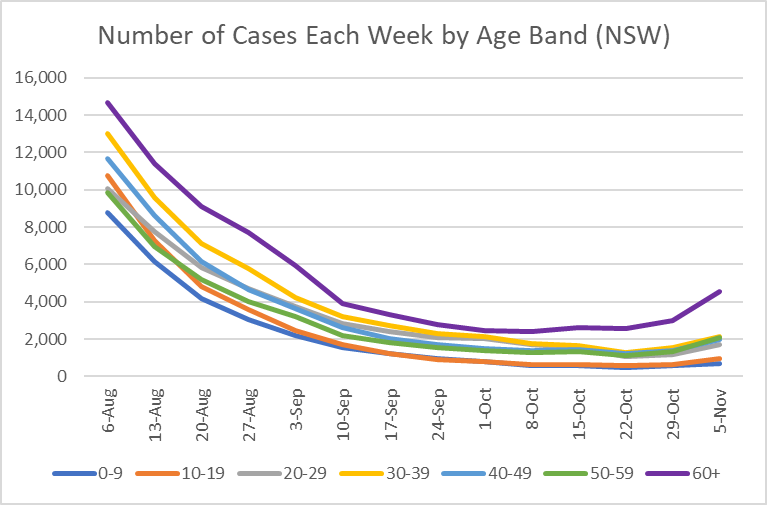
The NSW Health epi report for the week ending 5 November was released today.
I feel like I follow NSW reasonably closely, but there were a few surprises in here for me. #Covid19Aus#Covid19NSW
You can find the full report here... health.nsw.gov.au/Infectious/cov…
Surprise #1: Cases were up 45% this week, with 14,000 cases reported.
While this is still much lower than earlier in the year, it is a lot more cases than the weekly update suggested (the last weekly update was to 3 Nov, had 12,500 cases reported, up 24% on the previous week).
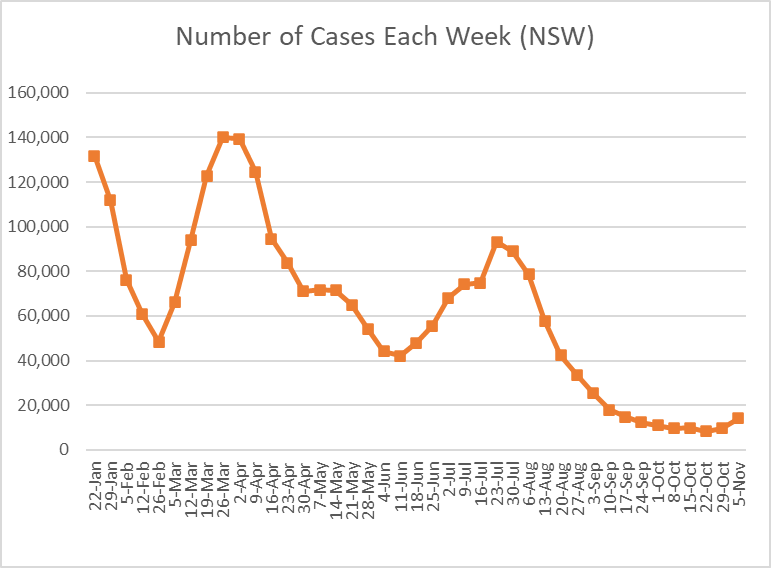
Surprise #2: The number of PCR tests conducted was up a bit (10%), but positivity increased A LOT to 14%. Not good.
By age band, there was a large increase in the 60+ age group. The group that is more likely to test and more likely to report it.
All of that together does not bode well for tomorrow's weekly update.
The number of people in hospital was largely unchanged (+1%)
But hospital admissions were up by about 30% (allowing for late reported admissions, shown as the "unknown" age group in the graph).
The increase was mainly in the 60-79 age group.
There were 24 deaths.
Note there was a change in the way deaths are counted, starting last week. NSW Health only counts deaths once a death certificate is lodged with Births, Deaths, Marriages.
Surprise #3: the big growth in variants of concern was in BA.2.75, specifically the BR.2 sub-lineage. Not BQ.1.1. of XBB.
Not sure if @Mike_Honey_ has anything to add here?
Ends/
• • •
Missing some Tweet in this thread? You can try to
force a refresh
The ABS yesterday released some new stats on life expectancy.
Before I comment on the numbers, I thought I'd explain what this measure of life expectancy is.
A thread/
There are two ways to measure life expectancy: 1. period life expectancy, which is what the ABS data is 2. cohort life expectancy, that I'll circle back to at the end of this thread.
Period life expectancy is the life expectancy of a person if they had the same mortality every year of their life as the "period" upon which the estimate is based.
e.g., the ABS table in their tweet shows the 2020 life expectancy at birth for Australia of 84.3 years.
The Actuaries Institute COVID-19 Mortality Working group has just released our new analysis of excess mortality using detailed data to 31 July 2022.
TLDR: Another huge excess in July. #COVID19Aus#ExcessMortality
You can find the full write-up here... actuaries.digital/2022/11/03/cov…
Note we measure excess deaths relative to pre-pandemic expectations of mortality, including allowance for continuation of mortality improvement (around 1.5-2% pa).
Our methodology also allows for changes in the size and age mix of the population.
Actual deaths (orange diamonds) in July were again very high, and well above the 95% prediction interval (blue shading).
Influenza in Australia in 2022.
A thread/
I'm writing this thread as, according to a friend travelling in Europe, there is a lot of sensationalist reporting about what a bad flu season we had in Australia in 2022.
This chart shows laboratory-confirmed flu cases nationally. It shows an early and high peak in 2022 compared with earlier years.
However, symptoms reported by participants in the FluTracking program were no higher than in pre-pandemic years, despite a lot of COVID circulating in Australia.
Source: www1.health.gov.au/internet/main/…
Our latest analysis of excess mortality is now out, covering all cause mortality to the end of June 2022, plus COVID-19 only mortality for July-Sept. #COVID19Aus#excessdeaths
TLDR: +11,200 excess deaths in first half of 2022 (13%) actuaries.digital/2022/10/06/cov…
Our excess deaths are measured relative to pre-pandemic expectations of mortality.
Includes allowance for continuation of mortality improvement/decline for each cause of death.
Allows for changes in the size and age composition of the population.
Excess mortality in the month of June 2022 was again very high, almost as bad as January 2022.
Needed to change my y-axis for this one.
In advance of our June excess mortality work coming out tomorrow, here is a thread on the latest COVID-19 data in Australia. #COVID19Aus
Here's a table showing the various bits of data we know about COVID-19 deaths.
Note with the change to weekly reporting, I have needed to estimate surveillance deaths for the last day of Sept (last 3 days for Qld).
This thread might be a good read for some of my new followers, explaining how Covid deaths are recorded in Australia, concentrating on the difference between daily surveillance reports and the ABS statistics.