Mike Hoerger, PhD MSCR MBA Profile picture
Nov 14, 2022 9 tweets 6 min read Read on X
Cloth masks could be customized to look amazing. BUT they offered weak protection (poor filtration, many gaps).

What if you could safely customize an N95 or #BetterMask with a small logo, decal, or other decoration?

THREAD 🧵

1/ 3M N95 with monotone cancer ribbon (or interpret as another
H/T 🎩 to @amandalhu for recommending rub-on “dry transfers.”

Follow her & see her amazing thread of several examples. Very fun, especially for kids. Many pre-designed options.


2/
But can dry transfers be customized?

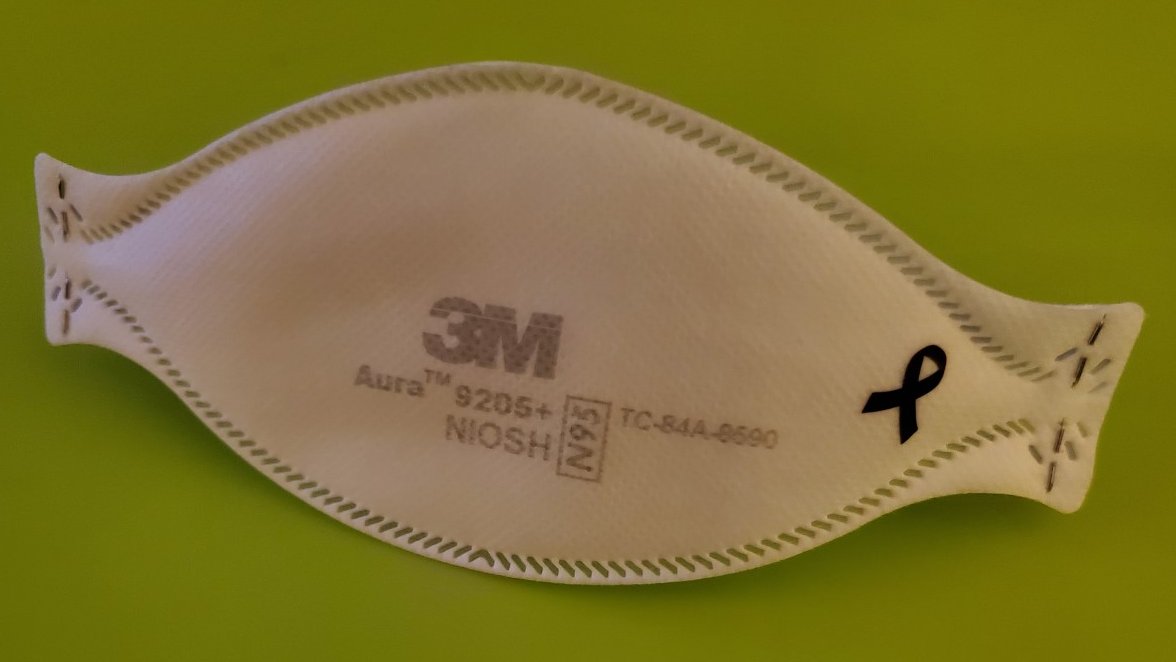
YES. I ordered a 6” x 6” sheet with >50 monotone #cancer ribbons from @stickermule. Cost about $20. Price goes waaaaay down the more you order. Comes with free hot sauce for some reason.

If you find other deals, please post.
3/ Sheet of dry transfers with >50 cancer ribbons.Randomly comes with hot sauce. Probably don't want to eat ri
Cut it out. Peal off the back. Press on the mask. Use a chopstick, spoon, or pen cap to rub on. Push against a hard surface.

It was too soft through the multiple mask layers, so I inserted a wooden block.

Peel off carefully. Then set the backing on top & rub once more.
4/ Dry transfersDry transfer placed on N95Set a hard object on the opposing side of the maskGrab something with hard plastic (these are children's chops
I run a #cancer research program.

My friend and collaborator Twitterless Jim Gerhart suggests in our forthcoming publication that we mask with health symbols to remind people that masking is a healthy choice, not a political one. So, I am testing these out.
5/ Wearing an N95 with dry transfer of a monotone cancer ribbon
Also added a ribbon to my @Flo_Mask.

The Flo Mask passes an at-home qualitative fit test with ease, unsurprisingly b/c @NgoTheWorld has meticulous attention to detail. Of course, you could just put a sticker on the non-filter part. 🤣
6/ Flo Mask with monotone cancer ribbon
Are N95s with small dry transfers safe? Yes, they are dry and block minimal surface area. No wet ink or alcohol used.

My go-to expert on mask failure -- @ghhughes -- approves.


7/
My masks still passed a fit test after putting on the dry transfers. No surprise.

FYI, to fit test, you just need a nebulizer & fit test solution (e.g., 3M FT-32). Spray near the problem areas (cheek, nose, chin). Breath through the mouth. If you taste bitter, bad fit.
8/ Nebulizer and 3M FT-32 fit-test solution
What did I miss? Have any good suggestions for pre-made rub-on dry transfers? Any good deals on customizable options? Questions on specifics?
9/

• • •

Missing some Tweet in this thread? You can try to force a refresh
 

Keep Current with Mike Hoerger, PhD MSCR MBA

Mike Hoerger, PhD MSCR MBA Profile picture

Stay in touch and get notified when new unrolls are available from this author!

Read all threads

This Thread may be Removed Anytime!

PDF

Twitter may remove this content at anytime! Save it as PDF for later use!

Try unrolling a thread yourself!

how to unroll video
  1. Follow @ThreadReaderApp to mention us!

  2. From a Twitter thread mention us with a keyword "unroll"
@threadreaderapp unroll

Practice here first or read more on our help page!

More from @michael_hoerger

Feb 17
1) PMC COVlD Dashboard, Feb 17, 2025 (U.S.)

🔥1 in 72 actively infectious
🔥Sustained high transmission
🔥30 states in high/very high transmission (CDC)
🔥3x the transmission of Feb 2021
🔥668,000 daily infections
🔥Only 1 in 28 cases reportedGraph shows 10 waves of the pandemic.  Tables summarized partially in post. Additionally, transmission is higher than during 59% of the pandemic.  How Does Risk Increase with More Social Contacts? Number of People | Chances anyone is infectious 1	1.4% 2	2.8% 3	4.1% 4	5.5% 5	6.8% 6	8.1% 7	9.4% 8	10.6% 9	11.9% 10	13.1% 15	19.0% 20	24.5% 25	29.7% 30	34.4% 35	38.9% 40	43.0% 50	50.5% 75	65.2% 100	75.5% 300	98.5%
2) PMC COVlD Dashboard, Feb 17, 2025 (U.S.)

This is a mid-sized wave, meaning substantial transmission. Notice that transmission remains steady at high rates.

Expect steady or slightly declining transmission, unless the real-time data are retroactively corrected.Two graphs, showing year-over-year transmission and the forecast, summarized in the post.
3) PMC COVlD Dashboard, Feb 17, 2025 (U.S.)

Notice that 30 states remain in high/very high transmission, per CDC categories.

This is the same as last week. Transmission is 3x higher than in Feb 2021, when people were taking more precautions around masking and testing.Transmission heat map and CDC line graph of regional variation in transmission.
Read 5 tweets
Feb 11
1) A lot of high-risk/aware patients I talk to -- mostly getting cancer treatment -- tend to protect themselves from infection by staying home more.

In the work we do, we help patients to understand that a well-fitting high-quality mask can allow them to attend events safely.
2) These are some tips for finding a well-fitting mask among common options in the U.S. and Canada.

3) Here's a more comprehensive diagram of masks that fit most. Aside from #5, these are widely available.

*#5 (Aegle) was the first N95 widely available during the ongoing pandemic for <$1. Hard to find these days, but I gave some to students.
Read 7 tweets
Jan 28
1) PMC COVID Dashboard for the Week of Jan 27, 2025 (U.S.)

🔹1 in 108 actively infectious
🔹3.1 million weekly infections
🔹>150,000 weekly resulting Long Covid conditions Current Levels for Jan 27, 2025 % of the Population Infectious 0.9% (1 in 108) New Daily Infections 443,000  New Weekly Infections 3,101,000  Resulting Weekly Long COVID Cases 155,000 to 620,000  Monthly Forecast Average % of the Population Infectious 0.9% (1 in 106) Average New Daily Infections 452,933 New Infections During the Next Month 13,588,000 Resulting Monthly Long COVID Cases 679,000 to 2,718,000  Running Totals Infections Nationwide in 2025 18,779,000 Average Number of Infections Per Person All-Time, U.S. 3.60  There is more COVID-19 transmission today than during 41.9% of the pan...
2) We predicted the wave peak would be 0.8 to 1.3 million across various forecasts. We presently have it at 0.9-1.0 million, though retroactive corrections can change that. The WHN also runs an excellent model, with a peak estimated at 1.3 million.
whn.global/estimation-of-…
3) Approx 1 million daily infections is quite serious. This is a far cry from the various #nothingburger predictions, and the Monday morning quarterbacks who in hindsight minimize U.S. infections, Long Covid, & disability.

Perhaps they have social media revenue COIs. I don't.
Read 9 tweets
Jan 20
1) PMC COVID-19 Forecast for Jan 20, 2025 (U.S.)

If we are lucky, the 10th wave has peaked, likely in the 0.9-1.1 million daily infections range, barring significant retroactive corrections.

Over the next month, we should still see about 14 million infections, resulting in 700K to 2.8 million new conditions and enduring symptoms under the umbrella of #LongCOVID. This is simply your reminder than transmission remains high on the back on of a wave.

Regarding the peak, there were huge retroactive downward corrections, especially in Oregon. The CDC data originally showed one of the largest waves there all-time, and then corrected it to say a complete lull the whole time. Once the Biobot data get updated, we may see the peak date change by a week, or jump a bit higher than what you see in the main figure.

What you see in the far end of the forecast is unlikely to be a "high lull," but rather an average between a low lull versus a sustained post-peak haunch of lingering transmission. So, keep an eye on the data. If you're putting off a non-urgent medical appointment, we could get into relatively lower transmission in the next 4-8 weeks. What has me concerned is a sneak-peek of @jlerollblues's long-term forecast indicating a clear possibility of an earlier "mid-year" wave than usual, perhaps even in April. We're still getting pretty lucky on the viral evolution front, but the longer that persists, in absent of major policy change, the bigger the wave we could get. It's a very important time to stay tuned.

Caveats: No data from Biobot in weeks (20% model weight). The California wildfires and pending severe storms in the Deep South are wildcards for transmission. School-based transmission could pick up, but to get a higher peak, transmission would need to pick up much faster in the South and West than in the Midwest and North (unlikely).

In the report, I note that PMC will persist even if the CDC drops or scales back their surveillance program. Also, the most two recent "odd" waves have helped clarify how to handle historical data, and a minor update to the model should help with future atypical waves. If time permits, we will fine-tune those changes further, but there are always more battles on the Covid front than we're able to fight. We also provide a link and light commentary on our recent pre-print showing what our current case estimation model for estimating present/prior daily infections has performed well, and why a lot of other models (BNO, JP, CDC) are underestimates.

Info for new readers:

For those unfamiliar with the PMC model, find full weekly reports for the past 1.5 years at pmc19.com/data

The models combine data from IHME, Biobot, and CDC to use wastewater to estimate case levels (r = .93 to .96) and forecast levels the next month based on typical levels for that date and recent patterns of changes in transmission the past 4 weeks.

Our work has been cited in top scientific journals and media outlets, which are fully sourced in a detailed technical appendix at pmc19.com/data/PMC_COVID…

Examples include JAMA Onc, JAMA-NO, BMC Public Health, Time, People, TODAY, the Washington Post, the Institute for New Economic Thinking, Salon, Forbes, the New Republic, Fox, CBS, NBC, and CNN. See pgs 11-13 at the above link.

#MaskUp #VaxUp #CleanTheAir #RapidTestCurrent Levels for Jan 20, 2025 % of the Population Infectious 1.1% (1 in 87) New Daily Infections 547,000  New Weekly Infections 3,829,000  Resulting Weekly Long COVID Cases 191,000 to 766,000  Monthly Forecast Average % of the Population Infectious 1.0% (1 in 102) Average New Daily Infections 466,700 New Infections During the Next Month 14,001,000 Resulting Monthly Long COVID Cases 700,000 to 2,800,000  Running Totals Infections Nationwide in 2025 15,281,000 Average Number of Infections Per Person All-Time, U.S. 3.59  How Does Risk Increase with More Social Contacts? Number of People | Ch...
2) Here is the issue of Oregon I noted, with the "disappearing surge" in the CDC data. By that, I don't mean a surge that declined quickly. I mean, the CDC saying there was a huge surge in OR and then saying it was a lull the whole time. Baffling.

3) It's an important time to reflect that we have never had a federal Covid response commensurate with the magnitude of this $14-billion problem in the U.S.

3/11/20-1/19/21 = 290K infections/day (91 million total)

1/20/21-1/19/25 = 759K infections/day (1.1 billion total)

10 waves and >1 billion estimated infections in 5 years.

We have never had a well-conceived multi-layered mitigation strategy, and the strategy we have had has often underachieved due to insufficient operational management.

This places society at greater systemic risk from repeat-infection Long COVID. The approach is unreasonable to people with primary immunodeficiencies, cancer, organ transplants, kidney disease, type 1 and 2 diabetes, Long COVID, pregnancy, and many other conditions. Upwards of 2 million older adults in the U.S. are in early retirement, with the labor participation rate still well below pre-pandemic levels, and older adults almost wholly accounting for that presently. The children that were pretended to be magically shielded from Covid are not doing well on the cumulative infection front either.

I do not see that changing. I hope the many scientists and public health officials biting their tongues the past 4 years now feel liberated to speak up on Covid. Note that state and regional organizations and individuals were a big reason why transmission was better under control in year 1 of the pandemic.

Note that our statistics are estimated "true" cases based on the PMC model, not reported cases, which are vast undercounts (ascertainment bias). See the first Tweet for info on our model, including our website, which contains hundreds of pages of reports (pmc19.com/data), or read our recent pre-print showing the high accuracy of our case estimation model, to the extent that is ascertainable (researchsquare.com/article/rs-578…). To believe the true infection estimates are lower than these figures, one would have to suspend cognitive reasoning and merely assume transmission happens at vastly lower rates in the U.S. than those documented through the most-rigorous testing-based program in Europe.figure showing the 10 Covid waves (U.S.)
Read 5 tweets
Jan 6
1) PMC COVID-19 Dashboard, Jan 6, 2025 (U.S.)

📈1 in 49 people actively infectious
🔥Nearly 1 million daily infections
🎲About a 50-50 chance someone has COVID in a large class if typical risk and no testing/isolating
🏥300,000+ new Long Covid conditions per week

The infections are likely minor underestimates. AZ and OR did not report this week. They were surging, so the lack of data brings down the average. As well, the model gives 80% weight to CDC wastewater data and 20% weight to Biobot, but Biobot took the week off, so this is dependent on observed changes in the CDC data.

It would be wise to add multiple imputation into the model to account for all the non-random missingness during surges, but I won't likely get to that anytime soon.

The peak is looking more and more like 1.4 million daily infections, but I wouldn't be surprised if it's earlier than shown and more like 1.3 million, based on the pattern of retroactive data corrections last winter. If the real-time data really stink, it could come in closer to 1.0-1.1 million. To top 1.6 million, we would probably need some serious immune escape that at present I just don't see happening. However, in past winters, transmission was declining nationally in early/mid January, and back-to-school is a wild card.

Info for new readers:

For those unfamiliar with the PMC model, find full weekly reports for the past 1.5 years at pmc19.com/data

The models combine data from IHME, Biobot, and CDC to use wastewater to estimate case levels (r = .93 to .96) and forecast levels the next month based on typical levels for that date and recent patterns of changes in transmission the past 4 weeks. Our work has been cited in top scientific journals and media outlets, which are fully sourced in a detailed technical appendix at pmc19.com/data/PMC_COVID…

Examples include JAMA Onc, JAMA-NO, BMC Public Health, Time, People, TODAY, the Washington Post, the Institute for New Economic Thinking, Salon, Forbes, the New Republic, Fox, CBS, NBC, and CNN. See pgs 11-13 at the above link.

We will have a pre-print out in the next week or so documenting very compelling evidence for the validity of using wastewater to estimate case rates. Forecasting is challenging in the context of the current viral evolution, but the real-time estimates of cases are impressively accurate to the best we can evaluate it.

#MaskUp #VaxUp #CleanTheAir #RapidTestCurrent Levels for Jan 6, 2025 % of the Population Infectious 2.1% (1 in 49) New Daily Infections 980,000  New Weekly Infections 6,860,000  Resulting Weekly Long COVID Cases 343,000 to 1,372,000  Monthly Forecast Average % of the Population Infectious 2.7% (1 in 38) Average New Daily Infections 1,272,833 New Infections During the Next Month 38,185,000 Resulting Monthly Long COVID Cases 1,909,000 to 7,637,000  Running Totals Infections Nationwide in 2025 5,468,000 Average Number of Infections Per Person All-Time, U.S. 3.55  How Does Risk Increase with More Social Contacts? Number of people |...
2) PMC COVID-19 Dashboard, Jan 6, 2025 (U.S.)

We're in the 10th wave of the pandemic (1st graph), and transmission this year has picked up atypically late, while coming on strong (2nd graph).Two graphs, summarized in tweet
3) PMC COVID-19 Dashboard, Jan 6, 2025 (U.S.)

Note that sputtering in the West's rise is likely an aberration, as surging OR and AZ did not provide data this week.

Read 5 tweets
Jan 3
📢Clean Air Advocates📢

I recently learned of a new strategy to get more clean indoor air to people's homes. I don't believe I've heard anyone mention this on here, but please add if you have made inroads.
1/
Last August, I was surprised to learn that Entergy, our regional energy company, was giving away free HEPA filters to customers.

This was surprising to me. Why would an energy company do this?
2/
Apparently, most jurisdictions in the U.S. have regulations that require a portion of consumers' energy payments to go toward an energy efficiency fund.

These are often used for discounts on thermostats but occasionally for Energy Star appliances.
3/
Read 4 tweets

Did Thread Reader help you today?

Support us! We are indie developers!


This site is made by just two indie developers on a laptop doing marketing, support and development! Read more about the story.

Become a Premium Member ($3/month or $30/year) and get exclusive features!

Become Premium

Don't want to be a Premium member but still want to support us?

Make a small donation by buying us coffee ($5) or help with server cost ($10)

Donate via Paypal

Or Donate anonymously using crypto!

Ethereum

0xfe58350B80634f60Fa6Dc149a72b4DFbc17D341E copy

Bitcoin

3ATGMxNzCUFzxpMCHL5sWSt4DVtS8UqXpi copy

Thank you for your support!

Follow Us!

:(