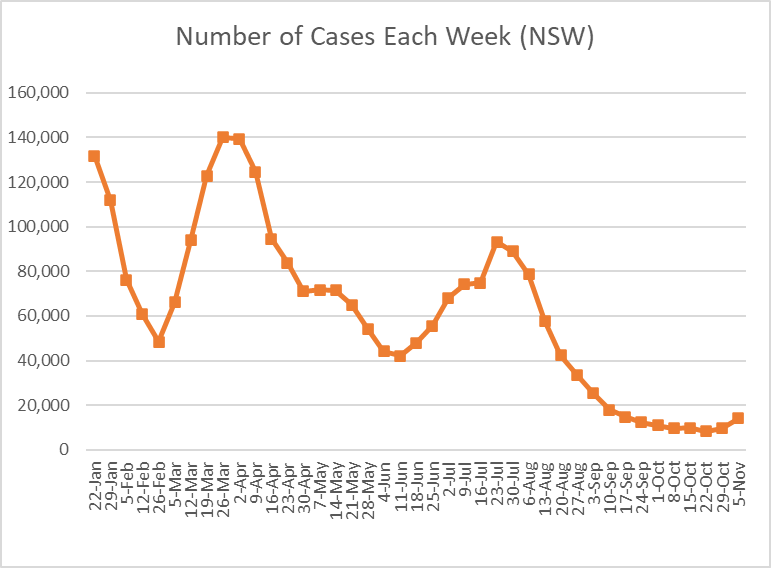
The ABS released some new data on Covid deaths today, looking at breakdowns by various demographics over the different Covid waves.
#COVID19Aus
A thread/
You can find the full report here...
abs.gov.au/articles/covid…
#COVID19Aus
A thread/
You can find the full report here...
abs.gov.au/articles/covid…
The ABS have reported on the following waves:
- wave 1 = March-May 2020
- wave 2 = June-Nov 2020, predominantly in Victoria
- Delta wave = July-Dec 2021
- Omicron wave = 2022, with some stats further broken down by month.
Data is based on registered death certificates.
- wave 1 = March-May 2020
- wave 2 = June-Nov 2020, predominantly in Victoria
- Delta wave = July-Dec 2021
- Omicron wave = 2022, with some stats further broken down by month.
Data is based on registered death certificates.
First up, they show a table of deaths *from* covid (ie. covid was the cause of death) versus *with* covid (ie. covid was a contributing factor). But I find my own graph easier to understand 🙃
Proportion with covid increased in the Omicron wave with increased prevalence.
Proportion with covid increased in the Omicron wave with increased prevalence.

Overall, during the Omicron wave 22% of covid deaths were *with* Covid.
The proportion dying *with* Covid is higher the younger the age band.
The proportion dying *with* Covid is higher the younger the age band.

Age breakdown of deaths *from* Covid by wave.
Wave 2 was dominated by deaths in aged care homes, hence the much higher proportion of older deaths.
The Delta wave occurred while vax rollout still underway, so more younger vulnerable people were at risk.
Wave 2 was dominated by deaths in aged care homes, hence the much higher proportion of older deaths.
The Delta wave occurred while vax rollout still underway, so more younger vulnerable people were at risk.

[As an aside, the youngest age band here is 0-59 years, so information on children and young adults is still hard to come by.
Part of the reason for this is that the ABS is restricted by legislation in what they can show. If a data cell is too small, ....
Part of the reason for this is that the ABS is restricted by legislation in what they can show. If a data cell is too small, ....
.... it is "non-publishable" as individuals can potentially be identified.
This is across all of their data, not just deaths.
But it is frustrating.]
This is across all of their data, not just deaths.
But it is frustrating.]
Consistent with overseas experience, more males have died from Covid than females, other than in Wave 2.
As noted earlier, wave 2 was dominated by aged care deaths, and approx 2/3rds of aged care residents are women.
As noted earlier, wave 2 was dominated by aged care deaths, and approx 2/3rds of aged care residents are women.

More males have died from Covid than females in all age groups other than the 90+ band, where females out-number males by about 2:1 (so the mortality RATE for females is lower than males in all age bands). 

Age standardised mortality rates by state for those who love state comparisons!
Only states with more than 20 deaths in a wave are shown.
In Omicron wave:
- NSW, Vic, NT and ACT similar
- Qld, SA and Tas similar and lower
- WA much lower.
As expected given border closures.
Only states with more than 20 deaths in a wave are shown.
In Omicron wave:
- NSW, Vic, NT and ACT similar
- Qld, SA and Tas similar and lower
- WA much lower.
As expected given border closures.

There is more information on Covid deaths:
- among ATSI people
- by country of birth
- by acute outcomes associated with Covid (i.e. covid caused pneumonia is the most common)
- by pre-existing condition (i.e. cardiac conditions, dementia, diabetes)
....
- among ATSI people
- by country of birth
- by acute outcomes associated with Covid (i.e. covid caused pneumonia is the most common)
- by pre-existing condition (i.e. cardiac conditions, dementia, diabetes)
....
- by socio-economic status
- by underlying cause for *with* covid deaths (cancer and dementia most common).
ends/
Any questions?
- by underlying cause for *with* covid deaths (cancer and dementia most common).
ends/
Any questions?
• • •
Missing some Tweet in this thread? You can try to
force a refresh


