While the world is caught up in the incredible features of #GA4, it's completely normal to overlook specific differences that make it so.
The ultimate breakdown of #GoogleAnalytics4 vs #UniversalAnalytics, by your new ultimate guide to GA4.
🚀Here it goes!
The ultimate breakdown of #GoogleAnalytics4 vs #UniversalAnalytics, by your new ultimate guide to GA4.
🚀Here it goes!
📊Different Data Models
#GA4 uses an event-based data model as opposed to UA's hit-type one.
📒Reporting Interface
#UniversalAnalytics had more reports, yes, but with #GoogleAnalytics4 you can customize your reports with all your favourite metrics.
#GA4 uses an event-based data model as opposed to UA's hit-type one.
📒Reporting Interface
#UniversalAnalytics had more reports, yes, but with #GoogleAnalytics4 you can customize your reports with all your favourite metrics.

🧑💻Bounce Rate and Engagement Rate
The new metric is called engagement rate. It measures the time spent on the landing page and monitors the visitors.
🧑⚖️IP Anonymization
Under #GDPR, your IP address is personal data. With #GA4, IP addresses are automatically anonymized.
The new metric is called engagement rate. It measures the time spent on the landing page and monitors the visitors.
🧑⚖️IP Anonymization
Under #GDPR, your IP address is personal data. With #GA4, IP addresses are automatically anonymized.

🗃️Data Retention
Your data on #GA4 expires after 14 months by default while #UA retains data almost indefinitely.
📶Enhanced Google Signals
#GoogleSignals, integrated with GA4, allows you to see how users engage with your website across devices and sessions.
Your data on #GA4 expires after 14 months by default while #UA retains data almost indefinitely.
📶Enhanced Google Signals
#GoogleSignals, integrated with GA4, allows you to see how users engage with your website across devices and sessions.

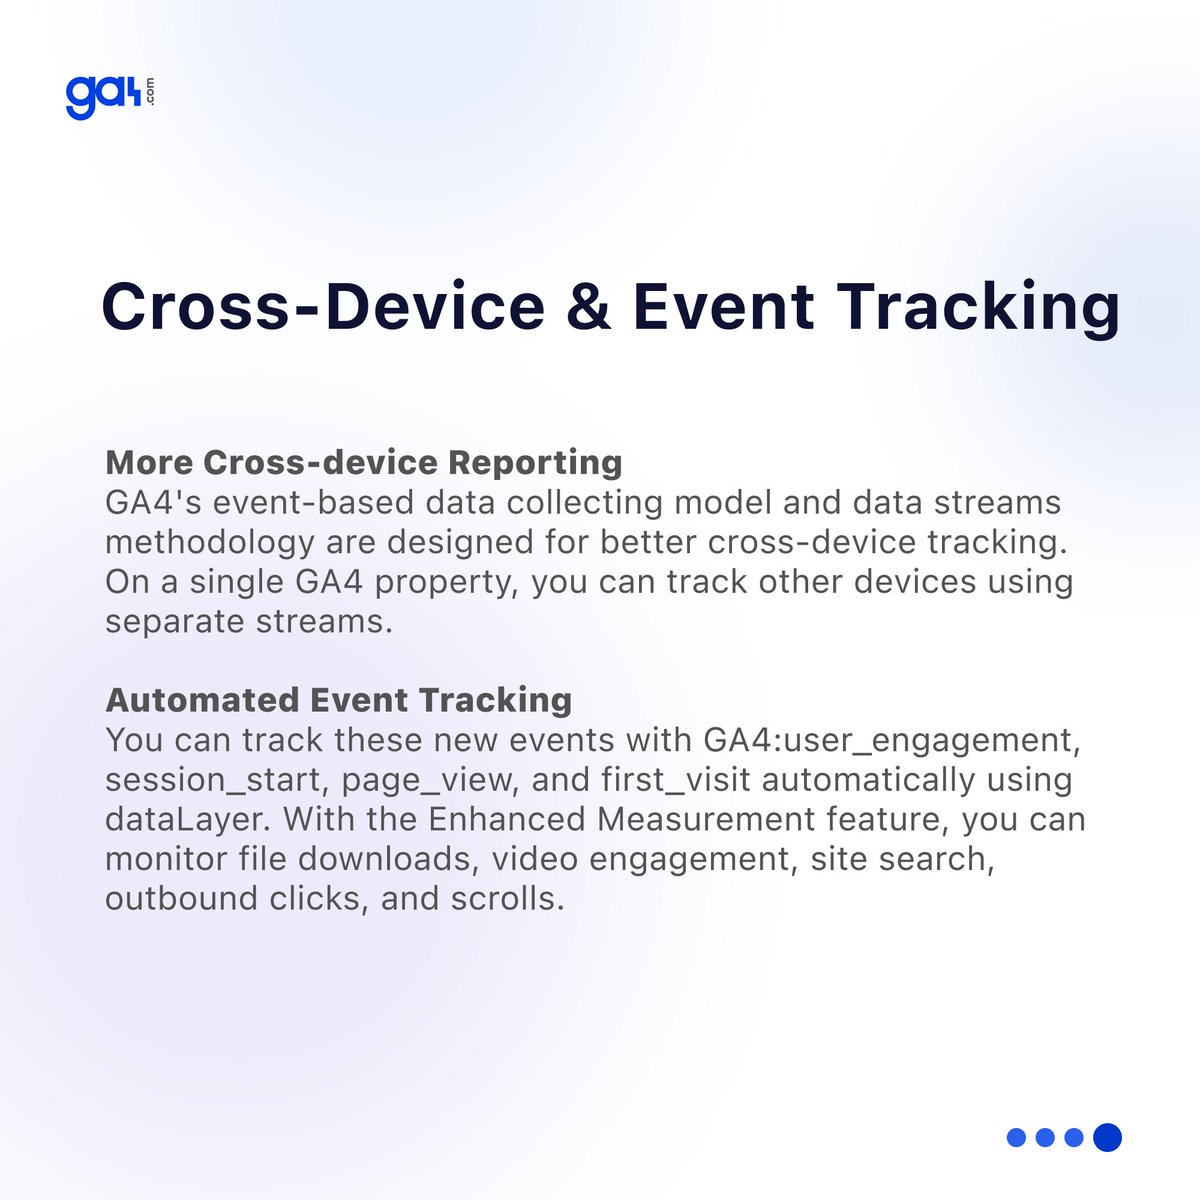
🔄Cross-device Reporting
While #UA's reporting is restricted, GA4's data streams and event-based data collecting model is designed for this.
💡Automated Event Tracking
GA4 lets you track many events such as session_start, page_view, and first_visit automatically using dataLayer.
While #UA's reporting is restricted, GA4's data streams and event-based data collecting model is designed for this.
💡Automated Event Tracking
GA4 lets you track many events such as session_start, page_view, and first_visit automatically using dataLayer.

• • •
Missing some Tweet in this thread? You can try to
force a refresh


