Day 6: Our @quarto_pub parameterised celebration of #RLadies working with the #NHS

I was keen to do something to celebrate the folks who use #rstats behind the scenes in the #NHS - building something with R to do so felt fitting!

Plus, I learnt more #quarto in the process!
@quarto_pub First step for me in doing something like this: Figma. It's a really useful tool for playing around with a layout before you try to implement it in code.

Here's the basic layout I built to figure out where everything should go. Image
@quarto_pub Next, fonts. For this one, I was looking for something that says "I know what I'm doing but I'm also approachable" as that was the vibe I got from folks at the @NHSrCommunity a few weeks ago.

I went with Nunito Sans, and found a "slab" font with a similar shape: Zilla Slab.
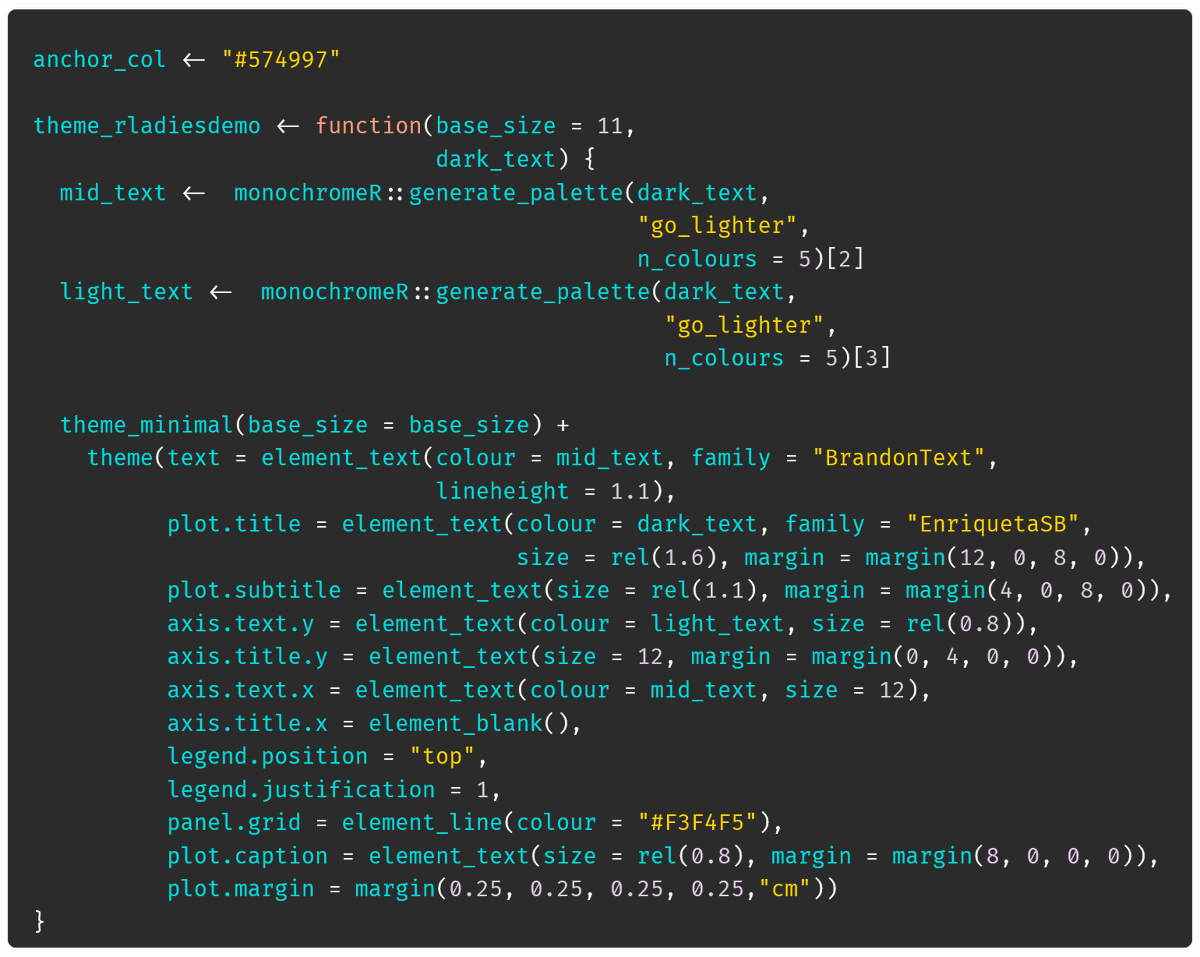
@quarto_pub @NHSrCommunity For our colours, I used a blend of the blue/purple in the logo as our anchor colour, a complementary teal colour for the title slide background, and graphs, the grey from the logo as our "link" colour. Then I used 📦 {monochromeR} to come up with a few variants.
@quarto_pub @NHSrCommunity The biggest headache was figuring out how to make the background colours work like this. Initially I'd thought I'd use an image, but it turns out when you resize the slides, that doesn't work so well.

Instead, here's the bit of code I added to the scss file: Image
@quarto_pub @NHSrCommunity The second headache was how tied together headers and slide separation is in @quarto_pub documents. I wanted the header to be contained within a column, so that the second column would start at the right height. No chance. So instead, I hacked a solution with an invisible slide.
@quarto_pub @NHSrCommunity I then wanted to get rid of the title slide, so I could more easily control its style. The easiest way round that was adding a blank html file and telling quarto that was the title. Then I made a title slide from scratch. Image
@quarto_pub @NHSrCommunity Now for the parameterisation. I made use of knit_expand() and knit_child() - and I have to be honest, I copy pasted the starting point from past project, so feel free to do the same with the code in the github repo!

This is the main content of the main file: Image
@quarto_pub @NHSrCommunity We made it! Have a good rest of the weekend!

• • •

Missing some Tweet in this thread? You can try to force a refresh
 

Keep Current with We are R-Ladies

We are R-Ladies Profile picture

Stay in touch and get notified when new unrolls are available from this author!

Read all threads

This Thread may be Removed Anytime!

PDF

Twitter may remove this content at anytime! Save it as PDF for later use!

Try unrolling a thread yourself!

how to unroll video
  1. Follow @ThreadReaderApp to mention us!

  2. From a Twitter thread mention us with a keyword "unroll"
@threadreaderapp unroll

Practice here first or read more on our help page!

More from @WeAreRLadies

Dec 2
Day 5: A worked example pulling all this together to build an Rmd-to-pdf template (using📦 {pagedown}) for @R_Girls_School!

There will be very little code in this one, because we're eagerly awaiting the Quarto-to-pdf equivalent, so I'm focusing instead on the principles I used. R-Girls mugScreenshot of branded lesso...
@R_Girls_School Rewind. I first heard about @R_Girls_School at the @NHSrCommunity conference, where the head teacher of Green Oak Academy, Dr Razia Ghani, came to share how they'd been teaching #rstats skills as part of lessons based on key subject of the curriculum (maths, geography, etc).
@R_Girls_School @NHSrCommunity Dr Ghani shared some quotes from the pupils about the hugely positive impact these lessons had on their interest in the subjects and on their confidence in their own ability to learn. There was quite a crowd around her at the coffee break keen to offer help and encouragement!
Read 12 tweets
Nov 30
Day 3: Writing functions to create parameterised graphs

So, we've picked our colours and set up a nice theme. We already know we want to apply this to all our plots but what if we could reuse the same plot code across different bits of the data?

Easy, let's make a function!
First, let's set up our plot. We're going to plot the number of penguins from each species within our dataset. We're using ggchicklet::geom_chicklet(), an anchor colour which is a blend of the blue and purple I mentioned on Day 1 and theme_rladiesdemo() which we built on Day 2.
Now let's add some labels, so we can state the number of penguins in each species, along with the mean body mass.

To do this, I'm using my go-to #rstats annotation package {ggtext}, which allows us to apply some CSS to create the text hierarchy principles from Day 2.
Read 14 tweets
Nov 29
2) Fonts. Picking fonts can be really tricky, but there are some really great resources out there (see below, where we're back to our "let others help you" mantra!).

Here, I've simply applied the fonts from my own website, changing the family element of element_text().
3) Text size. You can manipulate text size within theme() either by setting absolute sizes (e.g. size = 16), or relative sizes (e.g. size = rel(1.2)).

The relative size is a good idea if you're going to reuse this theme: change the base size as needed and everything follows!
At this point, we've done most of the work, but we can still make our data story easier to take in by giving everything a bit more space to breathe.

First, let's move the legend to reduce unnecessary eye movements, fade the grid, and remove an unnecessary axis title.
Read 9 tweets
Nov 29
Day 2: Building your very own ggplot theme.

Here are three reasons why I think you should do this:
- Help orient your readers with text hierarchy
- Give everything some space to breathe
- Achieve effortless consistency with one extra line of code

Sound good? Let's dig in!
My starting point for creating a custom theme is typically theme_minimal(). It has sensible defaults such as relative text size and margins that we can build on, by just replacing some elements.

plot +
theme_minimal() +
theme(customise here)

Here's our plot with theme_minimal()
Text hierarchy is one of those things it's so much easier to demonstrate than to explain. Take a look at this image. (© Chaosamran_Studio)

What it demonstrates is that the way we format our text guides readers as to what's most important and what we don't mind them skipping.
Read 14 tweets
Nov 28
Day 1: Setting up a bespoke colour scheme 🎨

🤫 I'm going to let you in on a secret... I find picking colours really tricky! Thankfully, I've found few ways round that.

My top tip is to let others help you! But first, a broad principle...
When picking colours for story telling, I try to make the colours as intuitive as possible.

Here's the adventure I took the Palmer Penguins on in a recent talk involving the #GreatPenguinBakeOff. See if you can guess the details. (The next tweet should give you a few clues!)
It's not about making your plots into a guessing game. It's about reducing cognitive load by making it easy to remember what's what.

And this allows me to illustrate one way to let others help you: photos! All of the colours in the previous plots were taken from these photos. Photos used to pick the colours in the bar charts above. Alt
Read 13 tweets
Nov 28
Hi folks! I'm Cara, an Edinburgh-based freelance data consultant, and I'm excited to be bringing you a week of #rstats content based around the things I enjoy creating the most: data visualisations and "enhanced" reproducible outputs.
Over the course of the week, we'll be exploring the different components that go into making a nice "branded" parameterised report, each day building on the days before until we get to our finished product: a parameterised celebration of RLadies within the NHS.

Here's the menu:
- Day 1: Setting up a colour scheme
- Day 2: Building a custom ggplot theme
- Day 3: Writing functions to create parameterised graphs
- Day 4: Manipulating text with R
- Day 5: A worked example of designing a pdf template (and a case for PDFs)
- Day 6: Our finished product!
Read 5 tweets

Did Thread Reader help you today?

Support us! We are indie developers!


This site is made by just two indie developers on a laptop doing marketing, support and development! Read more about the story.

Become a Premium Member ($3/month or $30/year) and get exclusive features!

Become Premium

Don't want to be a Premium member but still want to support us?

Make a small donation by buying us coffee ($5) or help with server cost ($10)

Donate via Paypal

Or Donate anonymously using crypto!

Ethereum

0xfe58350B80634f60Fa6Dc149a72b4DFbc17D341E copy

Bitcoin

3ATGMxNzCUFzxpMCHL5sWSt4DVtS8UqXpi copy

Thank you for your support!

Follow Us on Twitter!

:(