The COVID-19 Mortality Working Group of the Actuaries Institute released an update of our excess mortality analysis today, covering detailed ABS data to 31 August 2022.
#COVID19Aus #ExcessMortality
Strap in folks, this is a long one...
#COVID19Aus #ExcessMortality
Strap in folks, this is a long one...

(The blog has not quite been published yet. But I have things to do and needed to get this thread done. I'll link the blog at the end once it is published.)
As always, our excess deaths are measured relative to pre-pandemic expectations of mortality, including allowance for:
- changes in population size and age mix
- continuation of pre-pandemic mortality trends.
- changes in population size and age mix
- continuation of pre-pandemic mortality trends.
Terminology. COVID-19 deaths may be:
- "from COVID-19”, where COVID-19 is the underlying cause of death
- “with COVID-19”, where there was another underlying cause but COVID-19 was a contributing cause.
"Incidental COVID-19" deaths are not counted as COVID-19 deaths.
- "from COVID-19”, where COVID-19 is the underlying cause of death
- “with COVID-19”, where there was another underlying cause but COVID-19 was a contributing cause.
"Incidental COVID-19" deaths are not counted as COVID-19 deaths.
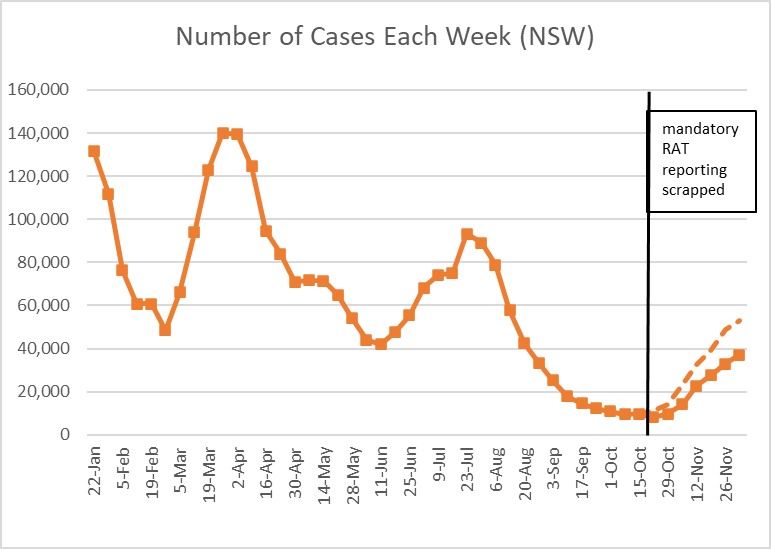
August saw another two weeks of very, very high deaths counts, followed by two weeks that were only very high.

We estimate 10% excess for the month of August, lower than previous months. This is due to lower respiratory deaths than predicted, reflecting the earlier-than-normal flu season.
Deaths from Covid fell across the month of August.
Deaths with Covid follow the same pattern as deaths from Covid, suggesting Covid is a catalyst rather than being merely coincidental.
Potentially also some blurring between the lines of from versus with Covid deaths.
Deaths with Covid follow the same pattern as deaths from Covid, suggesting Covid is a catalyst rather than being merely coincidental.
Potentially also some blurring between the lines of from versus with Covid deaths.
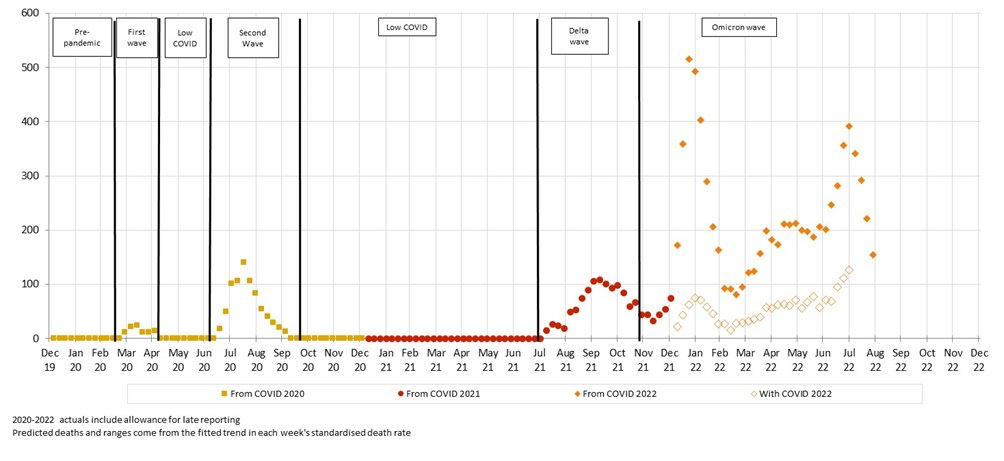
After removing from and with Covid deaths, significant excess remains, particularly around time of peak Covid (Jan) and flu (June/July).
Suggests delays in emergency care impacting, and/or possibly undiagnosed Covid.
Suggests delays in emergency care impacting, and/or possibly undiagnosed Covid.

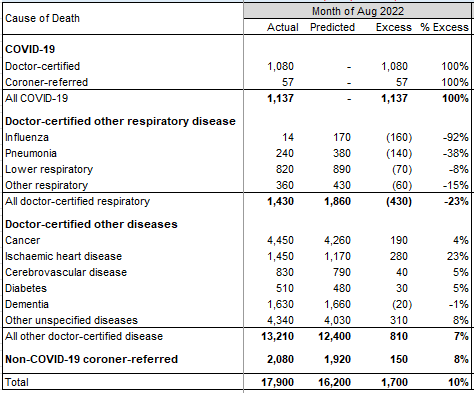
Breakdown by cause.
Total deaths to end August 2022 estimated at 13% (+15,400) higher than predicted.
Total deaths to end August 2022 estimated at 13% (+15,400) higher than predicted.

The next graphs show the excess for each underlying cause (so include with covid deaths).
All use the same y-axis to give a sense of relative contribution to the excess.
The 13 week average is shown to highlight any trend.
All use the same y-axis to give a sense of relative contribution to the excess.
The 13 week average is shown to highlight any trend.
Ischaemic heart disease: clear increase, and the biggest contributor
Cancer and cerebrovascular: increasing trends
Diabetes: higher than expected throughout the pandemic.
Cancer and cerebrovascular: increasing trends
Diabetes: higher than expected throughout the pandemic.

Dementia: negative excess in 2020 and 2021 (correlated with lower respiratory) followed by an increases in 2022 (correlated with COVID-19 and flu waves).
Respiratory: significantly lower than expected, except for the short, early flu season in June/July 2022.
Respiratory: significantly lower than expected, except for the short, early flu season in June/July 2022.

Other diseases: lower than predicted in 2020 (correlated with lower resp.) but, as a group, are the largest contributor to excess in 2021 and 2022.
Coroner-referred: include deaths from COVID-19 (estimated in red). Well above expected in the second half of 2021 and 2022.
Coroner-referred: include deaths from COVID-19 (estimated in red). Well above expected in the second half of 2021 and 2022.

Breakdown by age.
Table shows excess each year, both for all deaths, and again excluding deaths from and with Covid. Note 2022 is to end July only.
There are excess deaths in all age groups in 2022 and this is generally significant, even after removing COVID-19 deaths.
Table shows excess each year, both for all deaths, and again excluding deaths from and with Covid. Note 2022 is to end July only.
There are excess deaths in all age groups in 2022 and this is generally significant, even after removing COVID-19 deaths.

This graph shows excess by age band, each on the same scale. From and with covid deaths shown separately in orange.
Excess deaths in 2022 are dominated by the older age groups, but we generally also expect many more deaths in these age groups.
Excess deaths in 2022 are dominated by the older age groups, but we generally also expect many more deaths in these age groups.

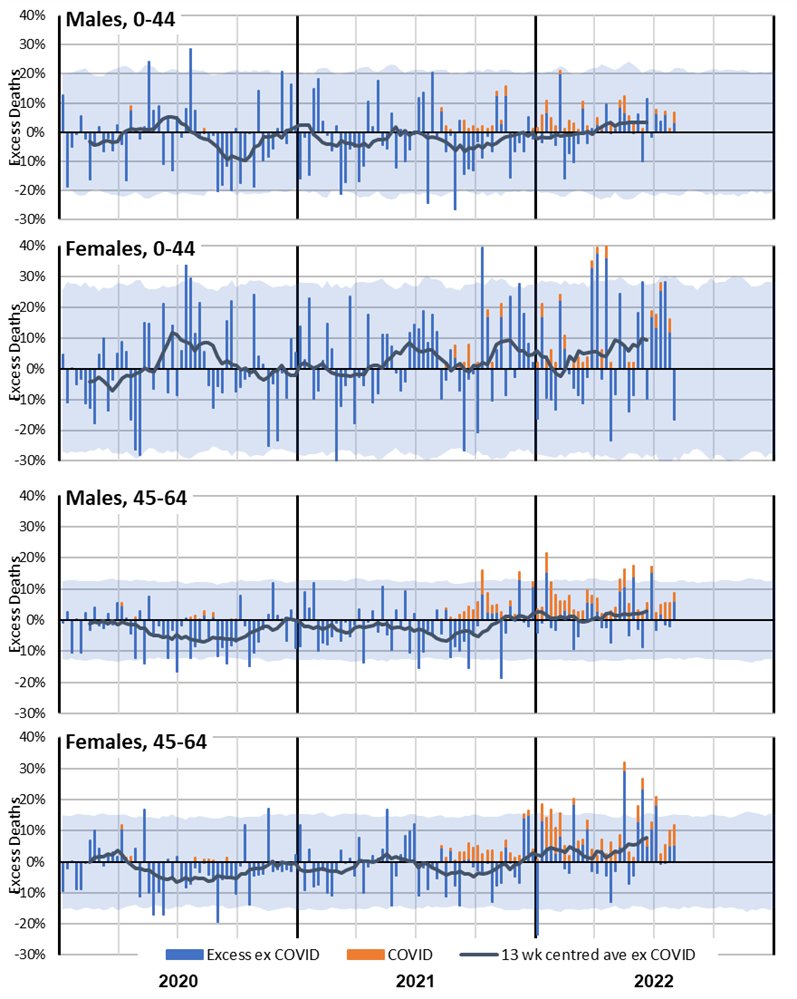
Here is the same graph but with the excess shown as a % of predicted deaths.
The older ages still experienced the most significant increase, however the younger age groups also had excess deaths in 2022 that are materially higher than expected.
The older ages still experienced the most significant increase, however the younger age groups also had excess deaths in 2022 that are materially higher than expected.

Female non-COVID-19 mortality experience in 2021 and 2022 is noticeably worse than male, especially in the 0-44 age band. Note the small numbers mean that there is considerable natural variation.
Breakdown by state.
Covid deaths in this table are from covid only (with covid not available). 2022 is to end of July only.
All states/territories apart from NT had significant excess in 2022, with about half due to Covid. WA lower than other states due to border closures.
Covid deaths in this table are from covid only (with covid not available). 2022 is to end of July only.
All states/territories apart from NT had significant excess in 2022, with about half due to Covid. WA lower than other states due to border closures.
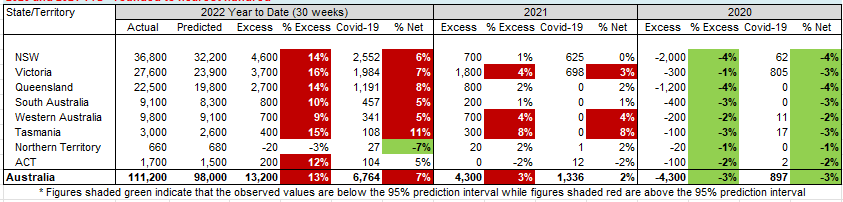
Victoria had a higher level of excess in the Delta wave in Q4 2021.
In 2022, the three largest states are similar, although Queensland’s second peak is larger than the first. SA is also similar, although more volatile. WA no Jan/Feb spike.
In 2022, the three largest states are similar, although Queensland’s second peak is larger than the first. SA is also similar, although more volatile. WA no Jan/Feb spike.

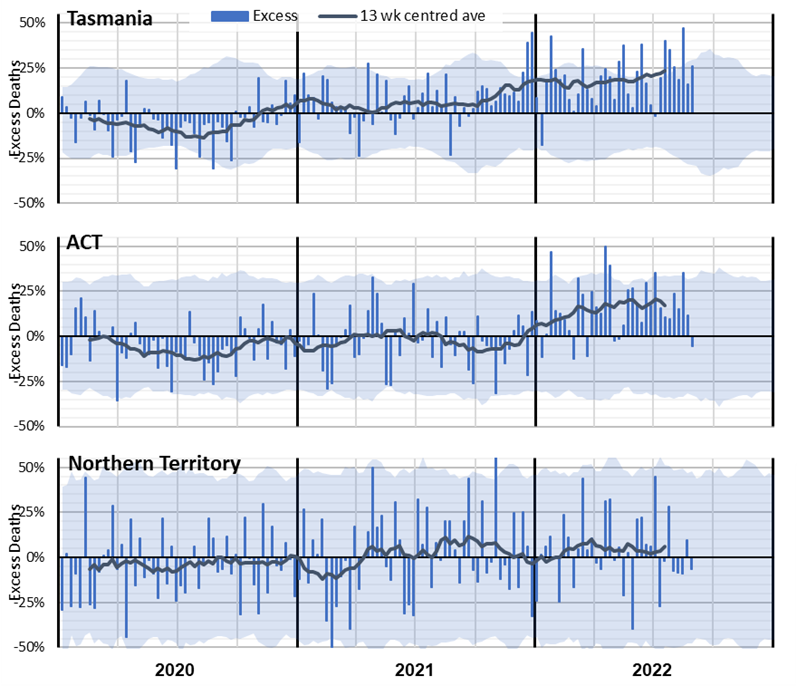
Allowing for volatility, Tasmania similar to larger states.
With a relatively young and affluent population, ACT has lower excess than larger states.
NT has a very young population, which might explain the low net impact of the pandemic, noting high volatility.
With a relatively young and affluent population, ACT has lower excess than larger states.
NT has a very young population, which might explain the low net impact of the pandemic, noting high volatility.
To summarise:
1. deaths with COVID-19 followed the same pattern as deaths from COVID-19 in 2022
2. non-COVID-19 excess deaths were highest when there were peaks in COVID-19 and influenza deaths
3. non-COVID-19 excess deaths are less apparent when there is no COVID-19 circulating
1. deaths with COVID-19 followed the same pattern as deaths from COVID-19 in 2022
2. non-COVID-19 excess deaths were highest when there were peaks in COVID-19 and influenza deaths
3. non-COVID-19 excess deaths are less apparent when there is no COVID-19 circulating
4. deaths due to some causes (dementia and “other” diseases in particular) are closely correlated to the level of respiratory disease circulating
5. non-COVID-19 excess deaths are particularly apparent in the oldest two age groups, and the youngest two age groups for females only
5. non-COVID-19 excess deaths are particularly apparent in the oldest two age groups, and the youngest two age groups for females only
Based on these observations, we have summarised the possible causes of non-covid excess mortality into this diagram, showing excess deaths from respiratory disease, other non-COVID causes and those from COVID-19.

Thank you if you made it this far!
There is a huge amount of content in this month's blog, much more than could be summarised briefly in this thread. So please dive in if you want more detail.
There is a huge amount of content in this month's blog, much more than could be summarised briefly in this thread. So please dive in if you want more detail.
This will be our last piece for the year. The next ABS release is on 22 Dec, so we have decided not to do an update then given Christmas/New Year. So our next piece will be in early Feb 2023.
And thanks also to my collaborators on the Working Group:
Richard Lyon - *literally* wrote the textbook
Jennifer Lang - Actuary of the Year 2020
Zhan Wang and Angelo Andrew - spreadsheeters extraordinaire
Han Li and Mengyi Xu - modellers of the complicated stats.
ends/
Richard Lyon - *literally* wrote the textbook
Jennifer Lang - Actuary of the Year 2020
Zhan Wang and Angelo Andrew - spreadsheeters extraordinaire
Han Li and Mengyi Xu - modellers of the complicated stats.
ends/
And here's the blog.
actuaries.digital/?p=111246341&p…
actuaries.digital/?p=111246341&p…
• • •
Missing some Tweet in this thread? You can try to
force a refresh