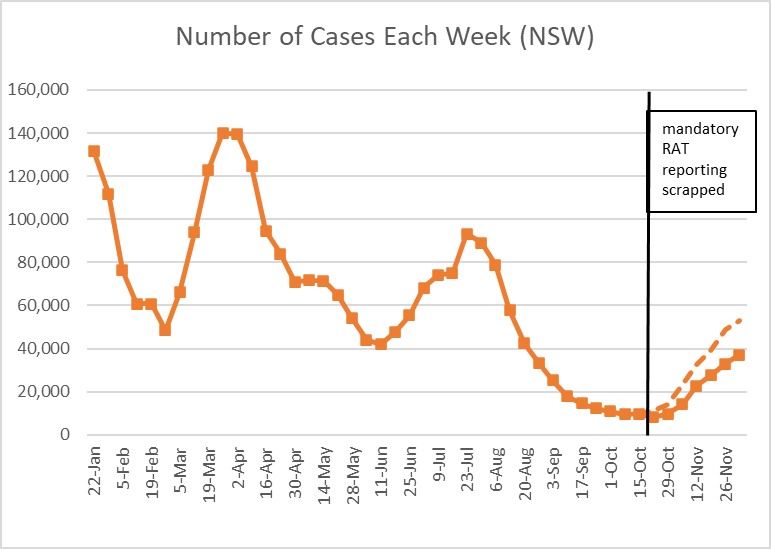
Reported cases are up 13% this week, a bit of a slowing in the rate of growth.
I've also estimated case numbers had mandatory reporting of RATS continued (dashed line). Approx 53,000 cases compared with 37,000 actual.
NSW Health has included a graph of furloughed health care workers, which provided a good correlation to case numbers prior to scrapping mandatory RAT reporting.
Hard to read off this graph, but it indicates maybe 55,000 cases had RAT reporting continued, so similar
The number of PCR tests is only a little higher than last week, but positivity has again increased - now 20%.
New video out by Dr Chant this morning, saying she expects the peak "in the coming week or so".
All age bands increased by about the 13% mark. 30-39 year olds lower at 5% growth
I thought I had won the "hospital admissions are lower this week" battle as it wasnt their leading bullet point this week. But no, it was still there, just relegated to 5th spot this week.
Hospital admissions have not decreased. They have increased by 15%
For my new followers, this is what the previous tweet is all about.
The number of people in hospital increased by 7%, lower than the last three weeks.
35 deaths this week, noting that NSW Health now only reports deaths as they are registered.
Variant picture has changed a bit.
BQ.1.1 still at about 18% of cases.
BA.5 reducing and now only about 18% of cases.
BR.2 growing and about 32% of cases.
BA.2.75 now lower at about 10%.
And this is my last NSW thread for a few weeks as I'm off on holidays. I'll be back mid-January.
Wishing everyone a covid-free christmas and new year!
ends/
• • •
Missing some Tweet in this thread? You can try to
force a refresh
The latest NSW COVID-19 Risk Monitoring Dashboard is out, with data to 5 December.
Short thread/
You can find it here... aci.health.nsw.gov.au/__data/assets/…
Growth in weekly cases has slowed a little (+11% versus +18-19% in the two previous weeks)
Growth in the number of people in hospital has also slowed (+6% versus 14-16% in the previous two weeks).
The COVID-19 Mortality Working Group of the Actuaries Institute released an update of our excess mortality analysis today, covering detailed ABS data to 31 August 2022. #COVID19Aus#ExcessMortality
Strap in folks, this is a long one...
(The blog has not quite been published yet. But I have things to do and needed to get this thread done. I'll link the blog at the end once it is published.)
As always, our excess deaths are measured relative to pre-pandemic expectations of mortality, including allowance for:
- changes in population size and age mix
- continuation of pre-pandemic mortality trends.
Cases up 19% in the week. As mandatory reporting of RATs was discontinued on 14 Oct, cases since then are not comparable to the earlier timeseries
Here are cases split between PCR and RATs. A rough estimate is that if RATs were still mandatory, we'd be pushing around 50,000 cases this week (rather than 33,000). (@dbRaevn usually does a more accurate estimate, utilising the info by age band.)
Anyone remember this thread I did on deaths by vaccination status? I said then that the vax status had not been linked to deaths which was why no analysis had been done.
But I was wrong.
I discovered today that the Australian Immunisation Register (AIR) has been linked to the Multi-Agency Data Integration Project (MADIP). health.gov.au/initiatives-an…
MADIP is a database maintained by ABS that includes information on health, education, government payments, income and taxation, employment, and population demographics.
Today's pedantry is brought to you courtesy of @NSWHealth. Specifically the "seven-day rolling average of daily hospital admissions".
(Apologies in advance to my long time followers who have heard me rant about this in the past.)
A thread/
Before I get into details, I'd like to say up front that I DO NOT BELIEVE that NSW Health (or any other Govt authority) is deliberately trying to hide data from the public, or to manipulate the statistics.
I think its more a combination of lack of resources, tricky concepts, etc.
So what's my issue?
Every week, in their main highlights, NSW Health has a statement like: "The seven-day rolling average of daily hospital admissions increased to an average of 63 admissions by the end of this week, compared with 55 admissions at the end of the previous week."
Proportion of employed people working fewer hours than normal.
I went purposefully looking for this data a few months ago and couldn't find it, and today I've stumbled across it!
A short thread/
The ABS Labour Force statistics cover reasons why employed people may have worked less hours than normal in a given month.
Reasons include:
- No work, not enough work available, or stood down
- Annual leave, holidays, flextime, or long service leave
- Own illness or injury or sick leave
- Standard work arrangements or shift work
- Personal reasons, study, caring for sick or injured family
- Maternity, paternity or parental leave
- Bad weather or plant breakdown
- Other.