1/3 √ Our global trade index contracted further, the most since July 2009 (-11.2% y/y)
√ For the first time since June, this was reflected in the volume of world exports which slowed to 1.7% y/y
2/3 √ In nominal terms, #EmergingMarkets exports had already peaked in June and preliminary data for November suggests a drop of 18% from that peak and 9% y/y
3/3 √ Obviously, a large part of this correction is due to a drop in export prices (8% for all EM), in particular the price of raw materials, which has caused the export prices of commodity exporting countries to drop by more than 14%
• • •
Missing some Tweet in this thread? You can try to
force a refresh
1/7 #China activity indicators for Nov came in much weaker than expected on Covid-linked restrictions and protests
. Too early for easing property measures to have an impact: floor space started remained at 13-year lows and residential demand is back to new cyclical lows
thread
2/7 . Overall construction activity was unchanged at cyclical lows and 24% below pre-pandemic trend while bottoming out on a y/y basis (-9.3% y/y vs -14.2% in Aug)
3/7 √ #China home prices fell for an 8th consecutive month, down 2.3% y/y, with 23 of cities having rising prices (up from 15% in Oct)
1/5 √ #US inflation was lower than expected thanks to a reversal in energy prices: down 1.6% over the month and declining to 13% y/y from 17.6% with much further to go
(thread)
2/5 √ #US core inflation came in also lower than expected thanks to a marked fall in the price of core goods (-0.5% m/m) while the rise in the price of core services remained unchanged at 6.8% y/y
3/5 √ Core services inflation remains essentially a story about rents (40% of core CPI), up 7.3% y/y and on a continuous rise from 2% in March 2021 while inflation on other core items is down to 5.2% from a peak at 8.6% in Feb this year
1/6 #China main activity indicators for Oct were generally weaker than expected, declining on a m/m basis
. Real estate sector disappointed again as floor space started remained at 13-year lows while residential demand dropped back to cyclical lows
(thread)
2/6 . Overall construction activity was unchanged at cyclical lows and 23% below pre-pandemic trend while bottoming out on a y/y basis (-9.7% y/y vs -14.1% in Aug)
3/6 √ Industrial production was one of the only indicators this month to avoid a contraction and continued to move around trend
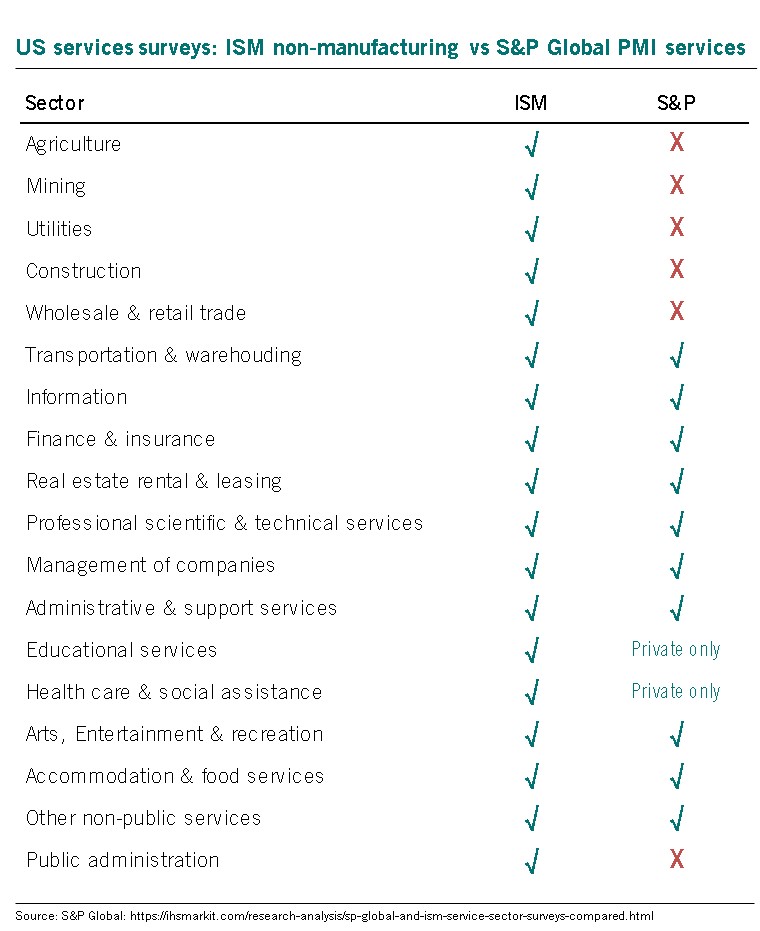
1/n The two different surveys of US services sent completely different messages 👇
√ S&P collapsed to 43.7
√ ISM rebounded to 56.9
Correlation between the two series has always been low, 10% in the pre-pandemic period, due to several differences between the two surveys
2/n √ different sectoral composition: ISM is non-manufacturing and thus includes sectors not covered by S&P: Table 👇 (reproduced from S&P here: bit.ly/3cZusKg)
√ Among other main differences: size of the firms surveyed, questionnaires and sectoral weighting
3/n Another difference is how they correlate with the consumption of services:
While they are both high since 2009 (ISM 57%; S&P 59%) they have nothing to do with each other when the pandemic is excluded: it rises to 69%👇 for the ISM but no longer exists for S&P (0%!)👇
1/n #China main activity indicators for July were generally lower than expected and in contraction on a m/m basis: (thread)
. Real estate sector was once again a big disappointment as floor space started plunged to 13-year lows while residential demand fell back to cyclical lows
2/n . Overall construction activity is down 13.6% y/y driving home prices lower (-1.7% y/y)
3/n √ Industrial production was slightly down (-0.2% m/m) back to trend