Kevin Fatkin Profile picture
Dec 28 9 tweets 8 min read
$TSLA is the talk of anyone #trading #options these days, so I figured it would be good to go through the data to see what the coming days may bring.
First off, there have been several news events related to $TSLA, including Chinese production slow downs, @elonmusk promising not to sell shares, and new gigafactory announcements. All these have made their splash and will continue to do so.
Lets start by looking at flow via @Tradytics. We see a major surge in put buying. However, compared to recent historical premiums, it wasn't the largest. Algoflow actually has this marked as neutral. The EoD spike can be telling though... ImageImageImage
The @Tradytics $TSLA delta correlations still show bearish momentum at play. The 1 day delta correlation is good, but neutral. However, 3 day and 5 day expectations are heavily bearish and very well correlated... ImageImageImageImage
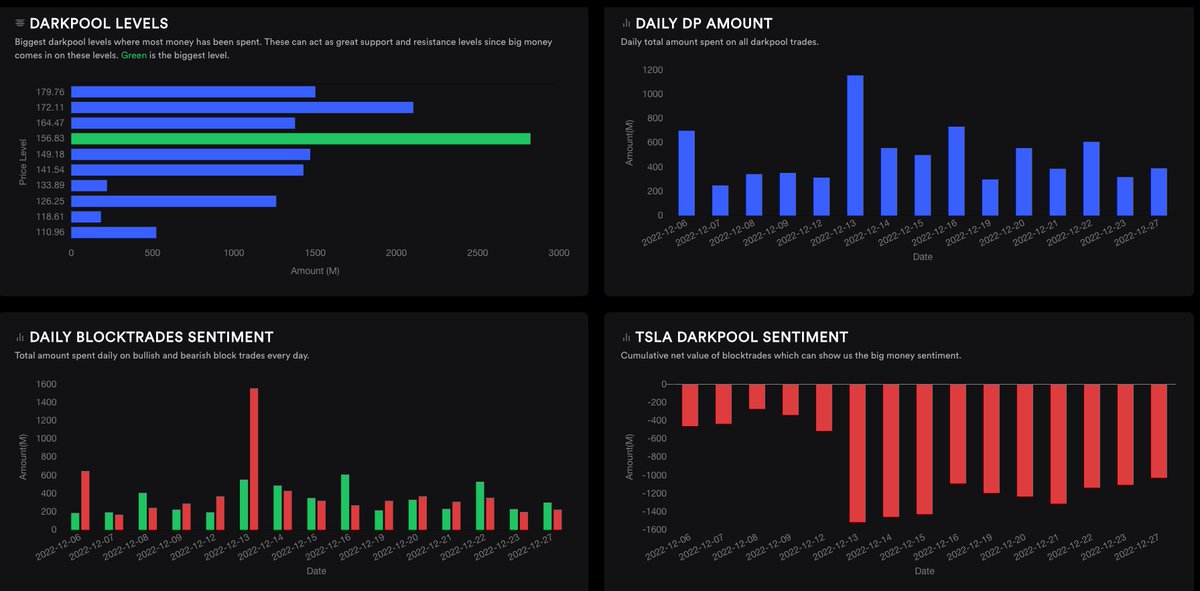
The @Tradytics $TSLA Dark Pool correlations for the next 7 days are also bearish. Block Trade sentiment is bearish and the largest levels are acting as resistance above us. However, here are some bullish prints scattered within. ImageImageImageImage
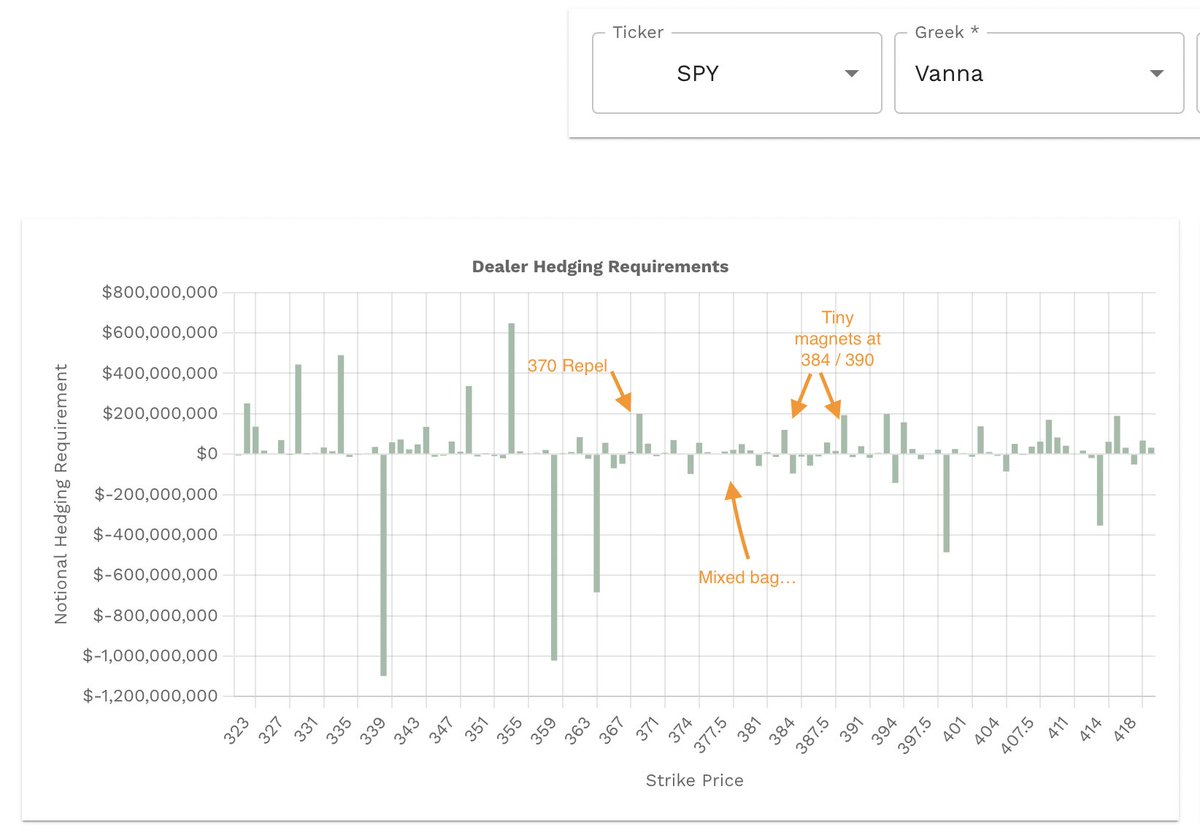
If we use @WizOfOps Vol.land data, we can get a very accurate depiction of dealer side hedging requirements. We can see that $100 will offer some dealer support, but rapid accelerant if shattered. $110 is now resistant (potential magnet). ImageImage
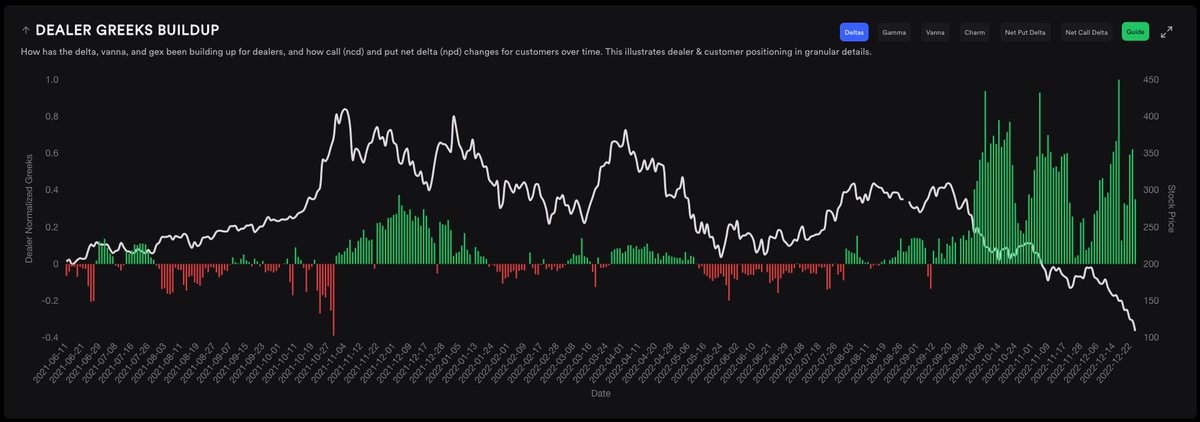
If we have Vol.land combine the #gamma, #vanna, #charm requirements for us, we see dealers are currently short about 1% of $TSLA's total Notational $ Volume traded today. The shorting gets worse as it goes higher AND lower (see screen shots). ImageImageImageImage
The Daily chart clearly shows a falling knife. No signs of institutions stepping in to buy $TSLA until $95 on the Daily. Personally, I never buy falling knives. I wait for a character change first. Earnings coming up on 1/25/2023 which may halt the descent. ImageImage
I'm not saying certain days won't present call scalping opportunities, however right now the data shows $TSLA is in a very bad spot. We'll see what the coming days/weeks bring. Be sure to keep an eye on the data as well! A curveball news/earnings event could change everything.

• • •

Missing some Tweet in this thread? You can try to force a refresh
 

Keep Current with Kevin Fatkin

Kevin Fatkin Profile picture

Stay in touch and get notified when new unrolls are available from this author!

Read all threads

This Thread may be Removed Anytime!

PDF

Twitter may remove this content at anytime! Save it as PDF for later use!

Try unrolling a thread yourself!

how to unroll video
  1. Follow @ThreadReaderApp to mention us!

  2. From a Twitter thread mention us with a keyword "unroll"
@threadreaderapp unroll

Practice here first or read more on our help page!

More from @Fatty_Trades

Dec 30
Today gave us a nice rally. In the beginning of the day, we knew $SPX and $SPY had magnets above and the market responded well to jobless claims in the AM (see morning thread). So how can we use this data to capture these large moves? How-to thread below👇
We could also see delta structure was most likely to be bullish on $SPY (see morning thread). All these factors (macro news, vanna/gamma, delta correlations) made me like upside. I prefer to primarily trade $ES, $NQ & $SPY, so I use this data to formulate my thesis before open. Image
However, once we view the data, we still need to play the chart. Even when I trade $SPY, I do it using the $ES chart and keep $SPY open in another window to keep tabs on it. Same with $SPX. My primary chart view looks like this, although I take my trades on my broker platform. Image
Read 15 tweets
Dec 29
Here is my morning run down of the current market outlook using Dark Pools, Dealer Positioning and market wide Options Flow to inform our #optionstrading and #futurestrading today. Data can change but it will help formulate a plan.
Lets start with $SPX Gamma and Vanna courtesy of @WizOfOps Vol.land. Small Vanna magnets from 3820 - 3840. Repellent @ 3750 & 3900. Positive Gamma resistance from 3820 - 3840. Small support @ 3775. Negative Gamma will accelerate if broken through. ImageImage
Let's do the same for $SPY using Vol.land Light Vanna repellents @ 370 & 385. Small vanna magnets @ 384 & 388. Gamma support @ 377, resist @ 384. Negative Gamma accelerants in between. ImageImage
Read 10 tweets
Dec 28
Can only do a light post this AM of Dealer & Dark Pool data, doing some traveling.
Lets start with $SPX Gamma and Vanna courtesy of @WizOfOps Vol.land. Once again, very light dealer participation. However, very small Vanna magnet @ 3850 and Repellents @ 3780 & 3900. We see even lighter (almost negligible) Positive Gamma @ 3825/3850. ImageImage
Next we have $SPY with even lighter participation. See screen shots for details, it's a bit of a mess. ImageImage
Read 6 tweets
Dec 23
This $NQ setup played out amazingly well. I wanted to touch on confirmations we can use to take advantage of this & any setup.

The session opens and we start dropping towards the area. We also have Trend Line Liquidity forming above that will likely be targeted.
The question on your mind is how do I know when to get in? It's a 20 point range including the FVG & OB so we don't just want to buy immediately, we need confirmation. For overnight confirmations on $NQ I prefer the 1m time frame. We close in and the FVG clears quickly.
Despite the move down, we see price begin to slowdown. This is our first queue to be ready. Now we need a confirmation candle. This can include bull hammers, engulfing, pin bars, etc. Ideally, we want to see a big increase in volume with price action confirmation.
Read 11 tweets
Dec 22
Here is my morning run down of the current market outlook using Dark Pools, Dealer Positioning and market wide Options Flow to inform our #optionstrading and #futurestrading today. Data can change but it will help formulate a plan.
Lets start with $SPX Gamma and Vanna courtesy of @WizOfOps Vol.land. The $SPX dealer involvement is still very light. See screenshots for small impacts various Vanna/Gamma levels will have.
Now let's do the same for $SPY but add in some additional data points from @Tradytics data driven insights. Vanna/Gamma also very light. See screenshots for small impacts. The delta correlations indicate range. The 15-day delta momentum flipped bearish (-0.05679).
Read 8 tweets
Dec 21
Here is my morning run down of the current market outlook using Dark Pools, Dealer Positioning and market wide Options Flow to inform our #optionstrading and #futurestrading today. Data can change but it will help formulate a plan.
Lets start with $SPX Gamma and Vanna courtesy of @WizOfOps Vol.land. The $SPX Vanna impact is minimal at these levels. Gamma is cluttered, with small amounts of support/resistance scattered in this zone. Could indicate more of a range day. ImageImage
Now let's do the same for $SPY but add in some additional data points from @Tradytics data driven insights. Vanna/Gamma also a bit of a choppy mess. Scattered weak levels in this zone. The 3-day Deltas indicate highest probability of staying in a range. ImageImageImage
Read 10 tweets

Did Thread Reader help you today?

Support us! We are indie developers!


This site is made by just two indie developers on a laptop doing marketing, support and development! Read more about the story.

Become a Premium Member ($3/month or $30/year) and get exclusive features!

Become Premium

Don't want to be a Premium member but still want to support us?

Make a small donation by buying us coffee ($5) or help with server cost ($10)

Donate via Paypal

Or Donate anonymously using crypto!

Ethereum

0xfe58350B80634f60Fa6Dc149a72b4DFbc17D341E copy

Bitcoin

3ATGMxNzCUFzxpMCHL5sWSt4DVtS8UqXpi copy

Thank you for your support!

Follow Us on Twitter!

:(