Yan Holtz Profile picture
Jan 3 10 tweets 6 min read
👋Are you interested in #dataviz?

⭐️I created 8 free online projects on the topic!😀

Please let me introduce them:

🧵.. A classification of chart types based on input data format
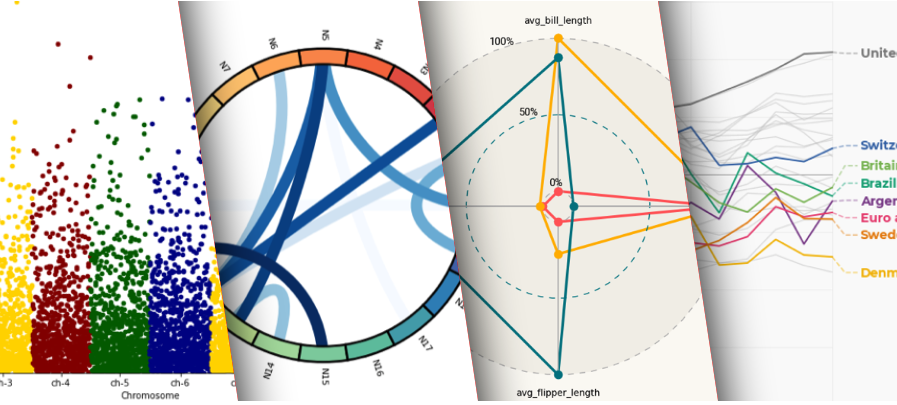
Everything started with the R graph gallery:

A collection of hundreds of graphs made with #rstats, always with explanation and code. (often using ggplot2)

r-graph-gallery.com
Since it worked well, I created the equivalent for all my #pythonprogramming friends!

@matplotlib and Seaborn are very good tool too!

python-graph-gallery.com
I often got asked what chart type to apply on what kind of data, so I created...

data-to-viz.com

➡️ A classification of chart types based on the input format. It's a decision tree with heaps of actionable content!
This project has a section dedicated to dataviz most common caveats.

It's a good practice to know them in order to avoid them

data-to-viz.com/caveats.html
I'm a very big user of R Markdown (websites above are created using it).

So I shared a few tips in a doc called

🎯Pimp My RMD🎯
holtzy.github.io/Pimp-my-rmd/

I you use #rstats, you should use RMD or Quarto!!
Want to add interactivity to your viz? It's time to jump into #javascript and the @d3js_org library.

The d3 graph gallery comes with basic examples & interactive sandboxes

d3-graph-gallery.com
Many people use d3 inside of a #ReactJS application, and it can be a hard task.

I'm currently working on the react-graph-gallery.com !
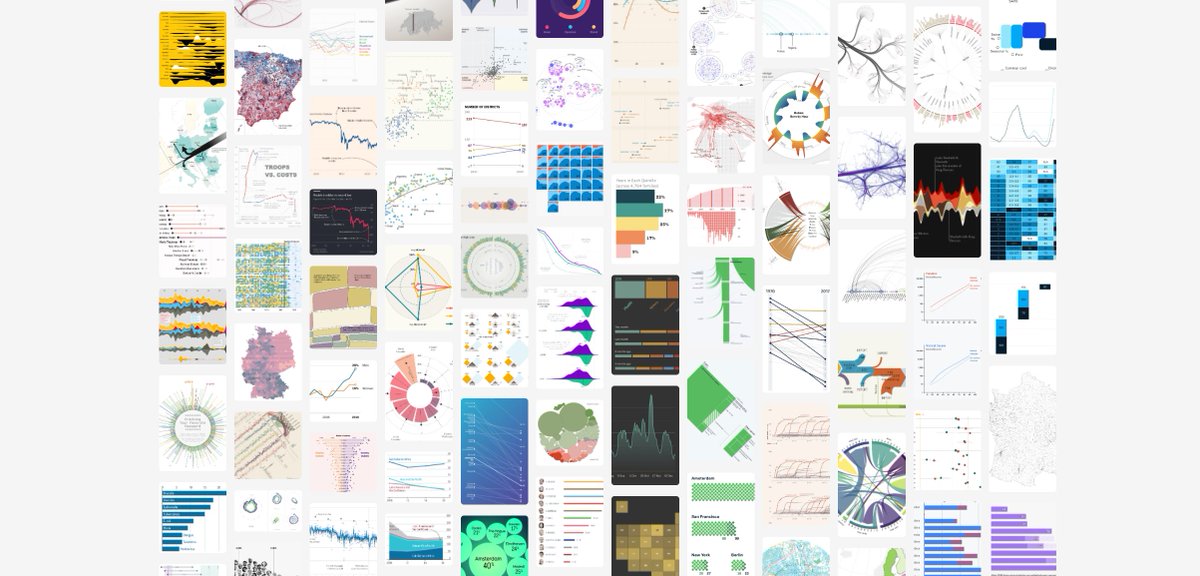
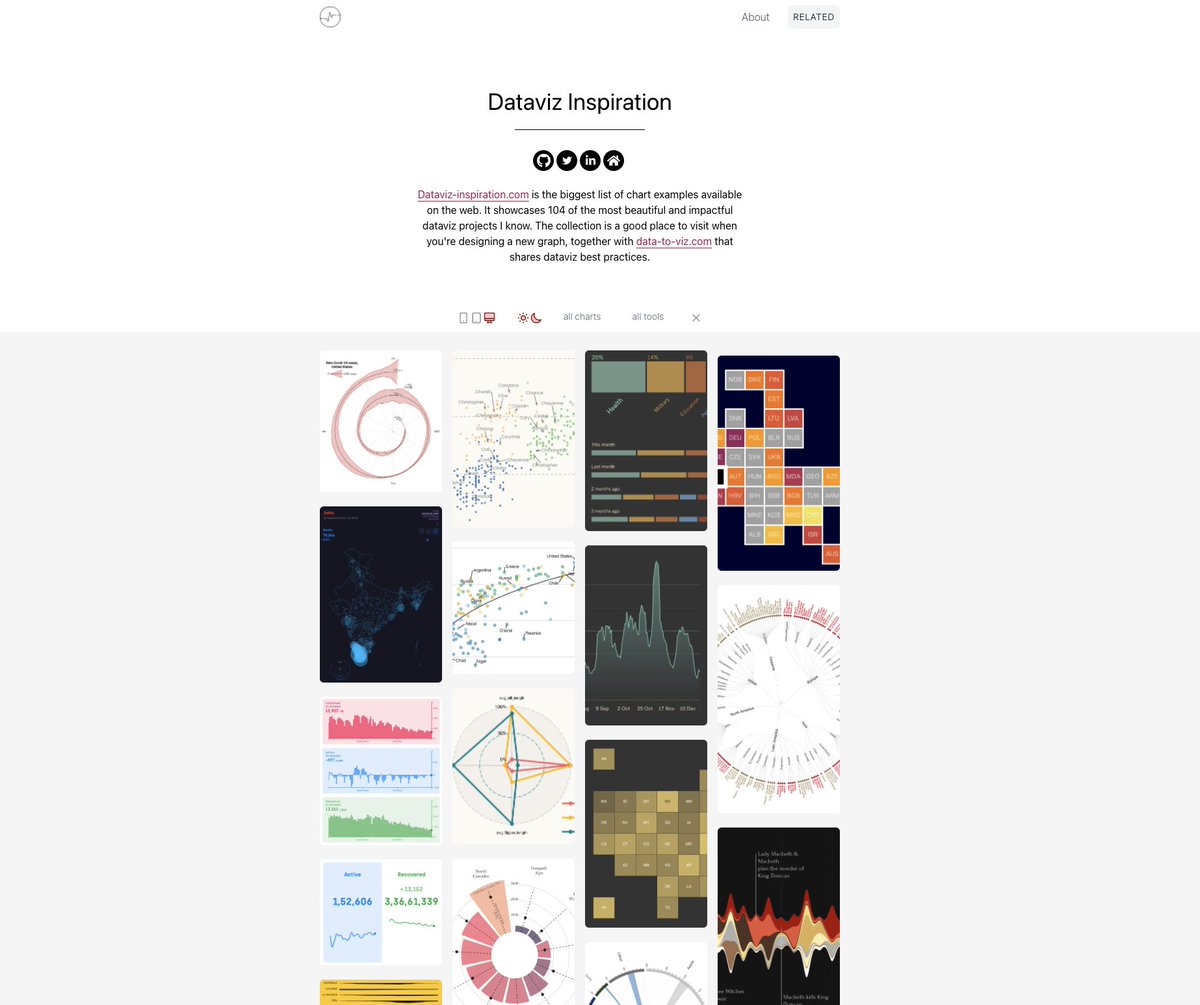
Since I spend my time browsing awesome viz projects, I decided to showcase all my favorites in:

Dataviz-inspiration.com

A growing collection that you can filter by chart types. Pretty handy when you're starting a new project!
Those projects are time consuming but I hope it helps

Please let me know
➡️ if you find them useful
➡️ if you have ideas to improve them
➡️ any other feedback

Thanks to all the contributors!🙏🙏🙏

• • •

Missing some Tweet in this thread? You can try to force a refresh
 

Keep Current with Yan Holtz

Yan Holtz Profile picture

Stay in touch and get notified when new unrolls are available from this author!

Read all threads

This Thread may be Removed Anytime!

PDF

Twitter may remove this content at anytime! Save it as PDF for later use!

Try unrolling a thread yourself!

how to unroll video
  1. Follow @ThreadReaderApp to mention us!

  2. From a Twitter thread mention us with a keyword "unroll"
@threadreaderapp unroll

Practice here first or read more on our help page!

More from @R_Graph_Gallery

Jan 4
My beginner/intermediate #Rstats friends often ask me for tips.

➡️Here is the 'dream pipeline' I use for my data analysis, ending with a clean, interactive, online report:

🧵..
Let's take a famous dataset: relationship between
- GDP per capita,
- population, and
- life expectancy

⭐️Tip 1⃣: Use ggplot2 and the tidyverse to get a clean chart easily.

r-graph-gallery.com/320-the-basis-… bubble chart built with ggp...
⭐️Tip 2⃣: make this graph interactive with ONLY 1 additional line of code 😍! I promise, just 1 more.

Thanks to the plotly package and its ggplotly() function.

You now have the details of each circle in a tooltip.

r-graph-gallery.com/bubble-chart.h…
Read 8 tweets
May 11, 2022
👋 I've made a new #dataviz related website! 😀

It's called☀️dataviz-inspiration.com: a list of many stunning Viz projects I love💜

🧵 dataviz-inspiration.com lis...
➡️For now, about 100 projects are showcased, resulting in ~150 beautiful graph examples.

📈But I will make it grow every day, instead of filling my bookmarks tab 😀 Image
🔎You can filter items based on chart types.

Let's say you have a #heatmap to build, it can be handy to see what people have made before you!

Chart classification is based on data-to-viz.com Image
Read 6 tweets
Oct 6, 2021
👋 I have 5 new @matplotlib python tutorials for #Dataviz 🤓
➡️stream chart, grouped barplot, histogram, linear regression and dual Y axis

python-graph-gallery.com

🧵
1⃣First one is about streamgraph. There is much more manual work involved than with #Rstats

python-graph-gallery.com/streamchart-ba…
2⃣ How to build a chart with 2 Y axes. A bad practice 99% of the time but still requested by many ppl so...

python-graph-gallery.com/streamchart-ba…
Read 7 tweets
Sep 2, 2021
✨I'm so proud to be back with a load of terrific #RStats and #Python3 charts, in collaboration with many highly talented people 🤓

🙏@CedScherer, @geokaramanis, @toeb18, @ClausWilke, @CaprettoTomas 🙏

A thread 🧵
🍾3 more charts by @CedScherer who's now having a pretty good exposition in the gallery🤓. Including stream chart, lollipop and line chart.

A sample of links:
🐍 stream: python-graph-gallery.com/streamchart/
🐍 lollipop: python-graph-gallery.com/lollipop-plot/
R line: r-graph-gallery.com/line-plot.html
☀️Since I love circular barcharts I couldn't miss the opportunity to add this work by @toeb18 on hiking location:

R: bit.ly/3kO1zAH
Python: bit.ly/3yDGy0s
Read 7 tweets
Jul 15, 2021
☀️New load of #rstats and #python charts 🚢

Would you know how to build them?

🧵🔗⬇️🙏
1/5 One more example by @CedScherer showing how to add proper labels on a line chart:

R: r-graph-gallery.com/web-line-chart…
Python: python-graph-gallery.com/web-line-chart…
2/5 One more example by @alextuowang: a good looking radar chart:

R: r-graph-gallery.com/web-radar-char…
Python: python-graph-gallery.com/web-radar-char…

btw, I know radar chart are criticised:
data-to-viz.com/caveat/spider.…
Read 7 tweets

Did Thread Reader help you today?

Support us! We are indie developers!


This site is made by just two indie developers on a laptop doing marketing, support and development! Read more about the story.

Become a Premium Member ($3/month or $30/year) and get exclusive features!

Become Premium

Don't want to be a Premium member but still want to support us?

Make a small donation by buying us coffee ($5) or help with server cost ($10)

Donate via Paypal

Or Donate anonymously using crypto!

Ethereum

0xfe58350B80634f60Fa6Dc149a72b4DFbc17D341E copy

Bitcoin

3ATGMxNzCUFzxpMCHL5sWSt4DVtS8UqXpi copy

Thank you for your support!

Follow Us on Twitter!

:(