Yan Holtz Profile picture
#datascience and #dataviz using #Rstats, #Python and #D3. Author of https://t.co/NN1oRBSU8w and 3 graph galleries
Lucas Costa Profile picture 1 subscribed
Mar 13 9 tweets 2 min read
You're starting a new Data Analysis project with #rstats or #pythonprogramming.

➡️How do you organise your work files? 🤔

Here is a thread about how I do it.

Any other best practice you use??

🧵 Image 1️⃣
Start with a "Input" folder
- Put your raw data in it. And NEVER edit it manually again.
- Make sure ALL the dataset required for the project are here. Your project must be self contained
Jan 4, 2023 8 tweets 4 min read
My beginner/intermediate #Rstats friends often ask me for tips.

➡️Here is the 'dream pipeline' I use for my data analysis, ending with a clean, interactive, online report:

🧵.. Let's take a famous dataset: relationship between
- GDP per capita,
- population, and
- life expectancy

⭐️Tip 1⃣: Use ggplot2 and the tidyverse to get a clean chart easily.

r-graph-gallery.com/320-the-basis-… bubble chart built with ggplot2
Jan 3, 2023 10 tweets 6 min read
👋Are you interested in #dataviz?

⭐️I created 8 free online projects on the topic!😀

Please let me introduce them:

🧵.. A classification of chart types based on input data format Everything started with the R graph gallery:

A collection of hundreds of graphs made with #rstats, always with explanation and code. (often using ggplot2)

r-graph-gallery.com
May 11, 2022 6 tweets 3 min read
👋 I've made a new #dataviz related website! 😀

It's called☀️dataviz-inspiration.com: a list of many stunning Viz projects I love💜

🧵 dataviz-inspiration.com lis... 
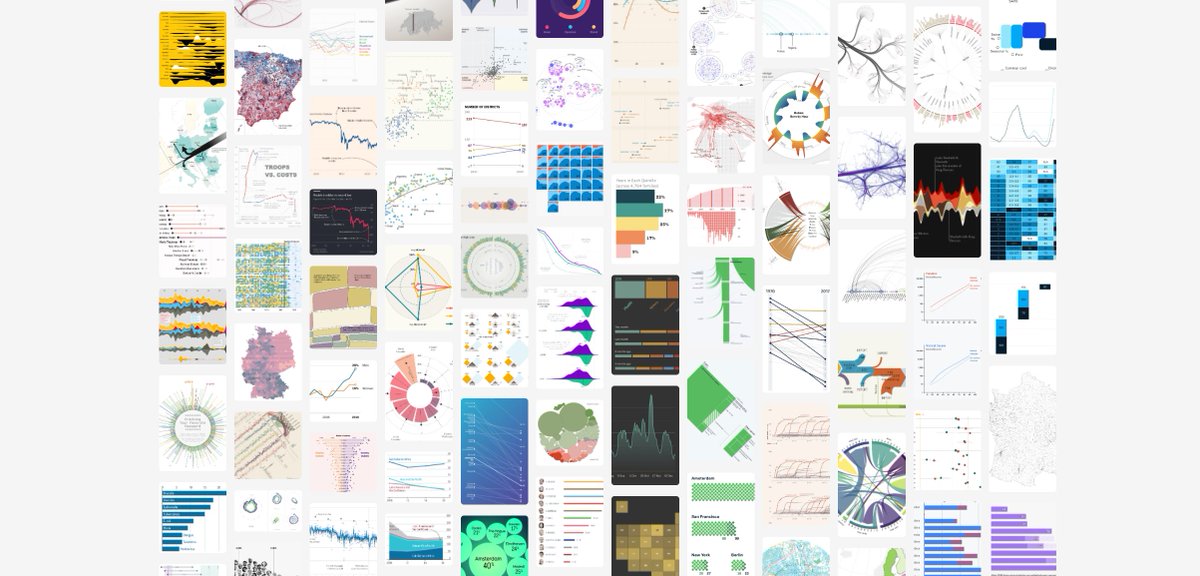
➡️For now, about 100 projects are showcased, resulting in ~150 beautiful graph examples.

📈But I will make it grow every day, instead of filling my bookmarks tab 😀 Image
Oct 6, 2021 7 tweets 4 min read
👋 I have 5 new @matplotlib python tutorials for #Dataviz 🤓
➡️stream chart, grouped barplot, histogram, linear regression and dual Y axis

python-graph-gallery.com

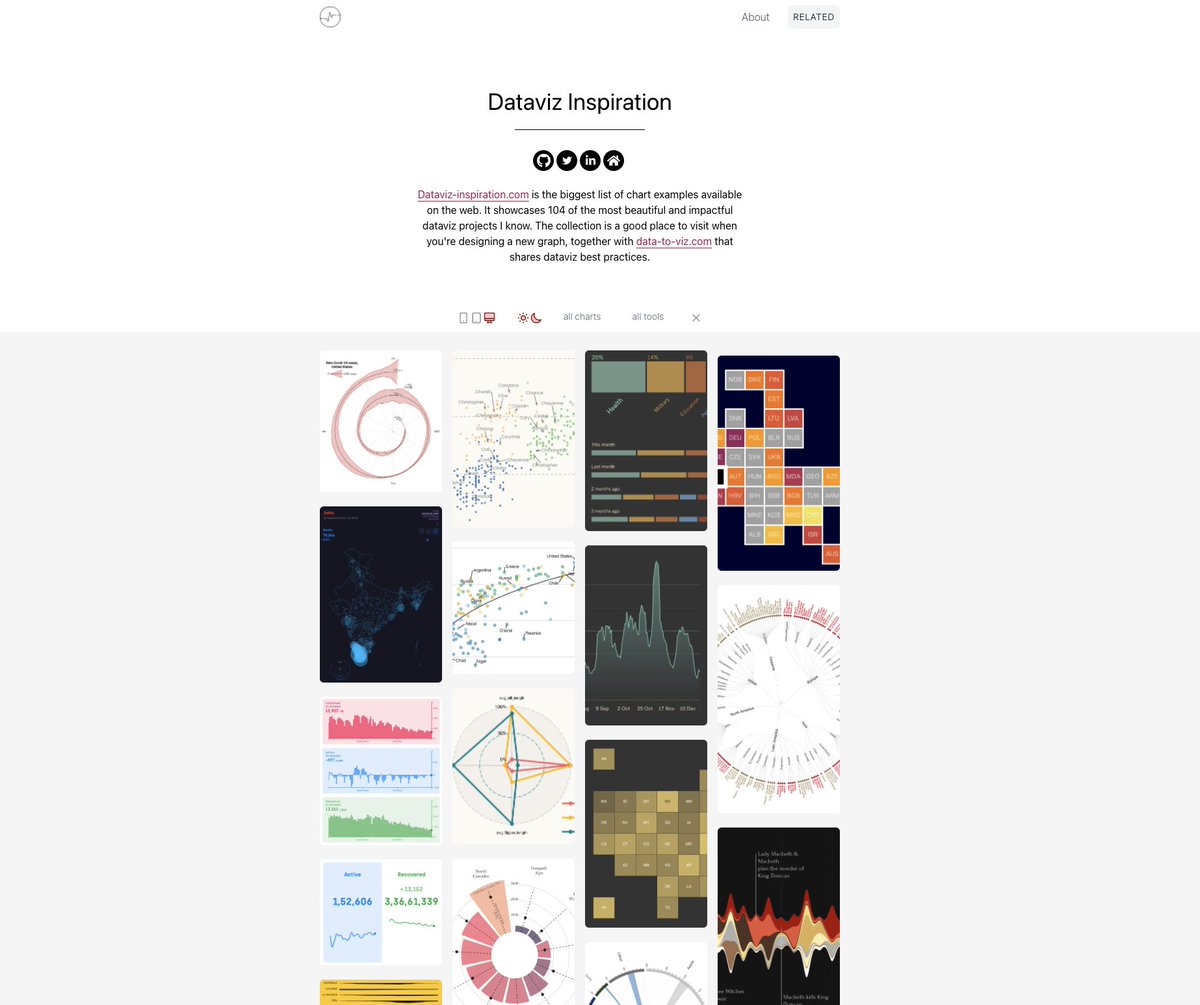
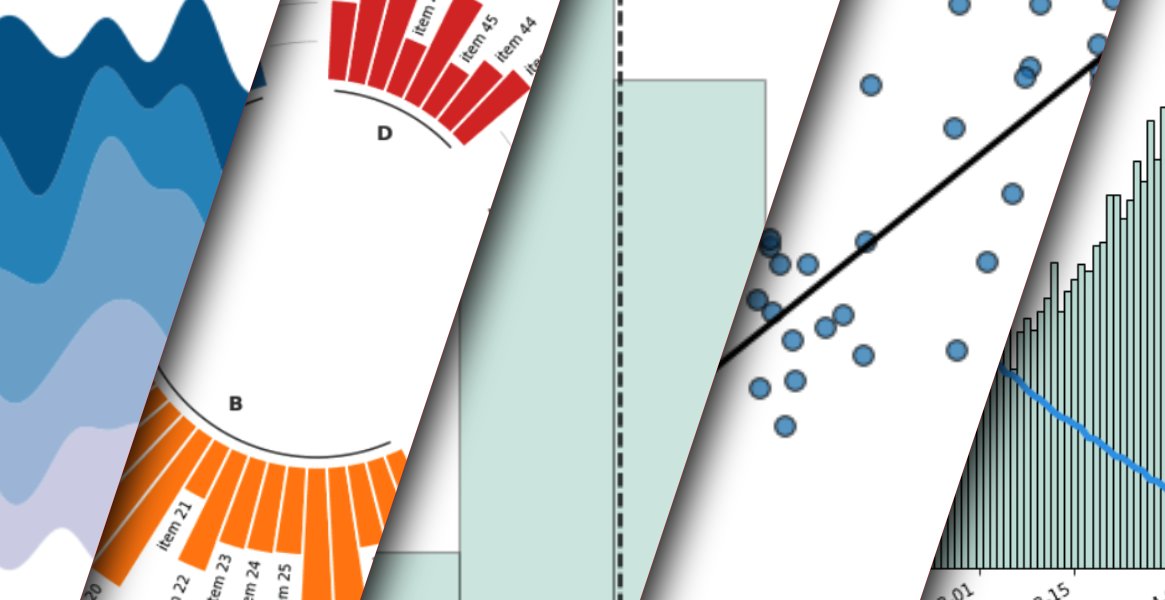
🧵 1⃣First one is about streamgraph. There is much more manual work involved than with #Rstats

python-graph-gallery.com/streamchart-ba…
Sep 2, 2021 7 tweets 7 min read
✨I'm so proud to be back with a load of terrific #RStats and #Python3 charts, in collaboration with many highly talented people 🤓

🙏@CedScherer, @geokaramanis, @toeb18, @ClausWilke, @CaprettoTomas 🙏

A thread 🧵 🍾3 more charts by @CedScherer who's now having a pretty good exposition in the gallery🤓. Including stream chart, lollipop and line chart.

A sample of links:
🐍 stream: python-graph-gallery.com/streamchart/
🐍 lollipop: python-graph-gallery.com/lollipop-plot/
R line: r-graph-gallery.com/line-plot.html
Jul 15, 2021 7 tweets 7 min read
☀️New load of #rstats and #python charts 🚢

Would you know how to build them?

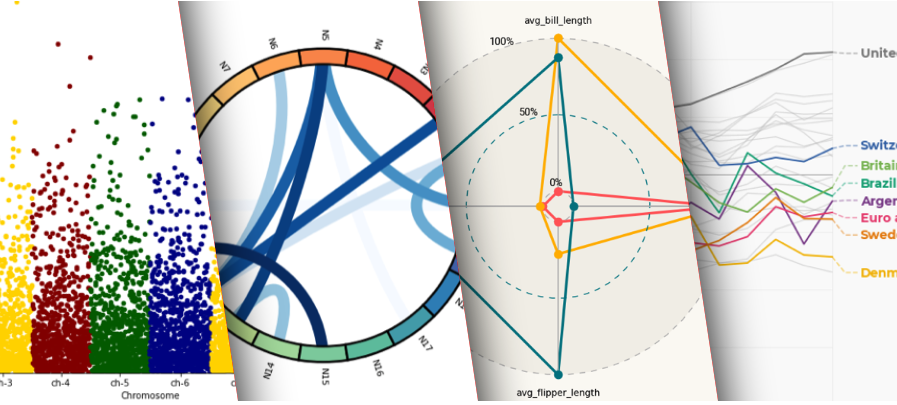
🧵🔗⬇️🙏 1/5 One more example by @CedScherer showing how to add proper labels on a line chart:

R: r-graph-gallery.com/web-line-chart…
Python: python-graph-gallery.com/web-line-chart…