& of course, for those who have the time, I highly recommend reading the full paper, here: doi.org/10.1016/j.ajcn…
But for those who prefer video or TW thread... HERE WE GO...
3/18) What the researchers did in this paper is perform a secondary analysis of pre-existing data from a 12-month RCT: the DIETFITS trial in which 609 adults aged 18-50 without diabetes were randomized to either a 12 m Low-carb diet (LCD) or low-fa diet (LFD).
4/18) Initial data showed LCD led to more weight loss than LFD at 3 and 6 mo, but that the between group diff in weight loss lost significance at 12 months
This was taken to be evidence against the CIM. However, as this paper reveals, there is more nuance to the story...
5/18) One important ? is why significance was lost at 12mo?
2 reasons...
i) Participant dropout. Each group lost ~80 participants, diminishing statistic power
AND
ii) Diet convergence: ‘Carb creep’ in the LCD group (132g/d) + carb drop in the LFD group (213g/d)
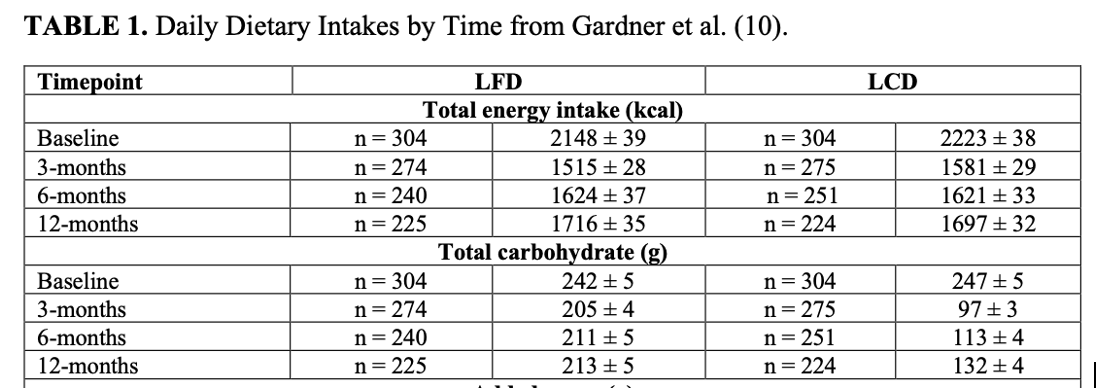
6/18) Even setting aside the dietary convergence, when missing data was imputed, the LCD group did in fact lose more weight at 12 m than the LFD group at all time points.
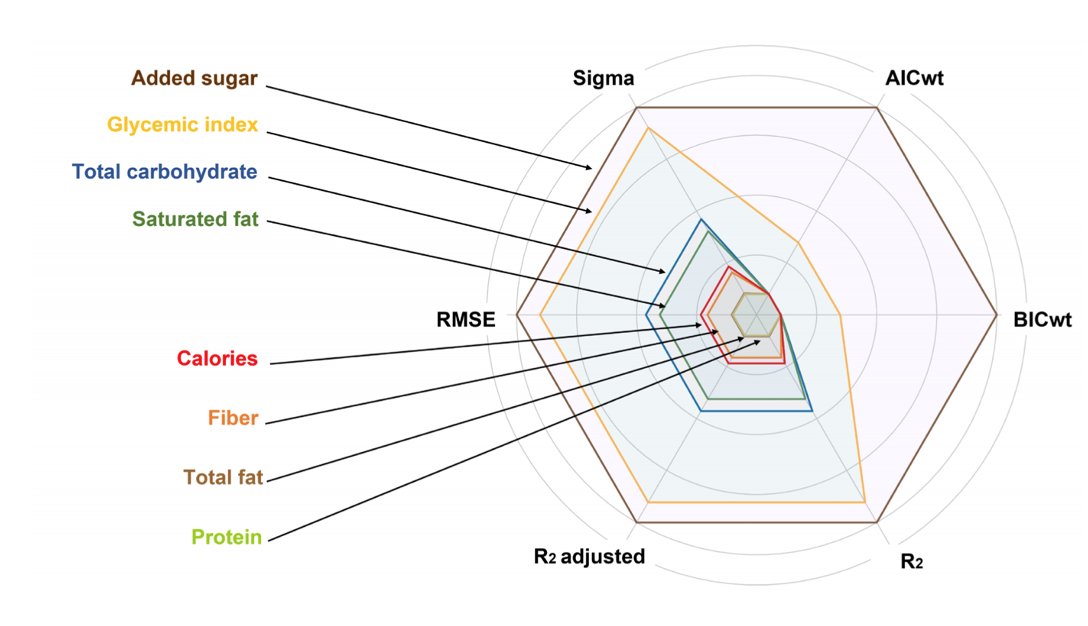
7/18) Moving on, Fig 2 shows a model of predictors of weight loss ➡️ larger circumferences represent better predictors of weight loss
🍽️🍽️Total fat & Calories were poorer predictors of weight loss
🍩🥭Carbs & GI and sugar are the superior predictors
Consistent with the CIM
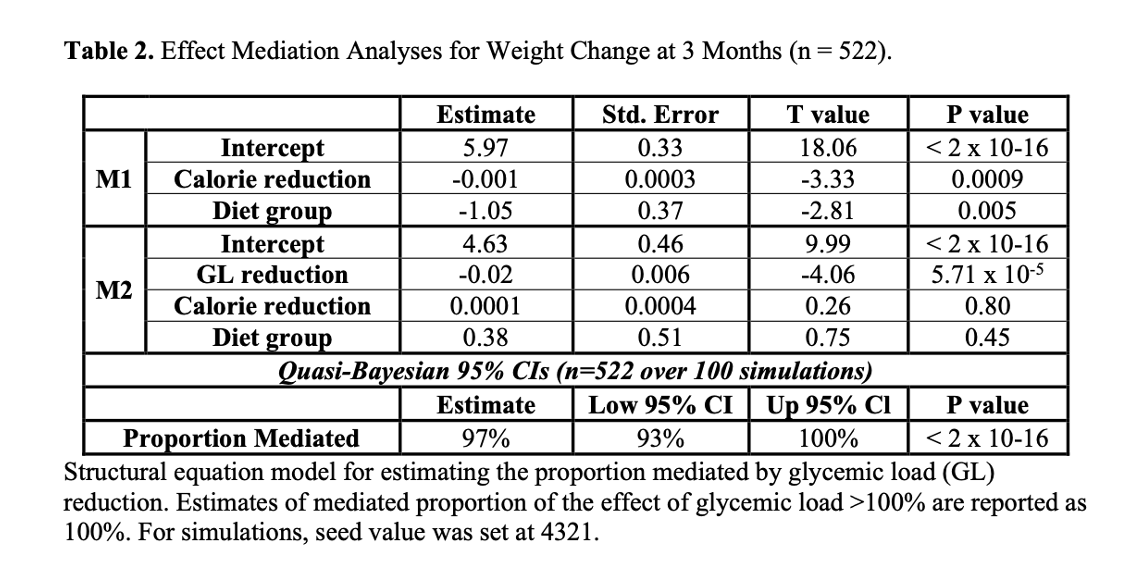
8/18) In Table are 2 models examining the mediators of weight loss
When you add in Glycemic Load (GL) is added to the model in model 2, GL is highly significant (p=5.7x10⁻⁵) and calories (p=0.80) LOSE significance!
Let’s expand on this point...
9/18) Many think that LCD works bc it just makes you eat fewer calories, but that it’s actually the drop in calorie intake that’s driving the weight loss. This certainly is a contributing factor but...
10/18) These results show that GL is better than caloric intake at predicting weight loss, which may appear counterintuitive BUT can be made intuitive if you think about the components of Energy balance: Calories in & Calories out...
11/18) The CICO model, when taken in CLINICAL practice, usually focuses on CI because accurately measuring CO accurately is next to impossible (think, NEAT, TEF, body temp, etc.)
12/18) By contrast, if GL influences the hormonal milieu of the body, it dictates NOT ONLY hunger and caloric intake (CI) but also homeostatic mechanisms to maintain energy equilibrium, or tip it one way or another, through CO: NEAT, body temp, etc.
13/18) Simply put, one could actually make the argument that the CIM is actually a superior real-life ‘CICO’ model than the standard cal counting CICO model itself!
LOL If that doesn’t make sense, read ^ again and watch video for completeness
14/18) Other cool data presented in this paper consistent with the results already shared is that, in fig 5, a biomarker of low-carb/GL (TG/HDL) was strongly associated with weight loss whereas a biomarker of fat reduction (LDL+HDL) was not.
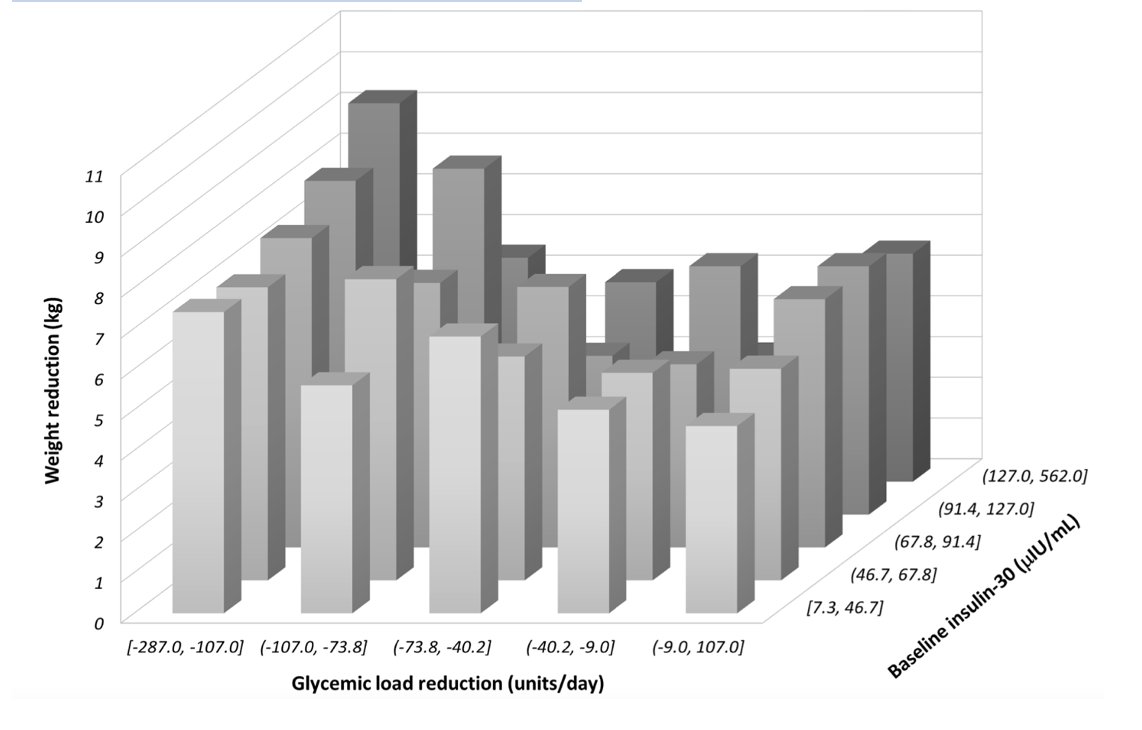
15/18) Finally, and beautifully, the authors put a bold prediction of the CIM to the test which is that those with higher basal insulin secretion would benefit most for GL reduction. Again, this is b/c in the CIM GL influences insulin to cause fat storage.
16/18) So, if someone naturally is an insulin hyper-secreter, the effect of the model is simply going to be amplified. As a result, those who secrete a lot of insulin probably benefit the most from reducing GL. Is that the case? As it turns out yes!
17/18) Clearly see an interaction b/w GL reduction and basal insulin
As you can see in the back left row, these persons who reduced GL most and were the insulin hyper secreters, lost the most weight!
18/18) In summary, this paper provides powerful evidence for two prediction of the CIM: (1) GL > Calories as a predictor of weight loss and (2) insulin hyper secreters benefit most from carb reduction.
🥛This Saturated Fat Can Burn Fat: A Milkshake Experiment?!🥛 (🔗at the end)
Saturated fat is one of the most misunderstood nutrients in nutrition. Part of this misunderstanding stems from a stereotype: Saturated fats are often lumped together as if they are homogenous entity.
But they are not.
1/7) In today’s StayCurious Metabolism Letter, I make the point by reviewing data showing how one specific saturated fat, stearic acid, positively influences mitochondrial fusion-fission dynamics and fat metabolism.
At the end I also provide you a boarder evolutionary framework in which to understand these data and related general principles of nutrition and offer some practical takeaways
2/7) Stearic acid is an 18-carbon saturated fat found in certain tallow, cocoa butter, and shea butter.
👉The study in question set out to investigate the effects of stearic acid, an 18-carbon saturated fat (C18:0), on mitochondria. The researchers took a diverse group of individuals—including those who were healthy and those with type 2 diabetes—and placed them on a low-fat vegan diet for two days in order to reduce their saturated fat and stearic acid intake.
They then gave the participants a stearic acid milkshake (24g of C18:0) or a mock control shake looked at the participants’ mitochondria at 0, 3, and 6 hours later.
🚨When given stearic acid, but not the control, the percentage of “fused” mitochondria increases ~4-fold. This did not happen with the control drink.
🚨By contrast, stearic acid restriction in the form of the low stearic acid vegan diet caused mitochondria to fracture and fragment. (More on the long-term effects later.)
If you want a pop-culture analogy, think of it like assembling the Avengers. Individually, they’re impressive, but together, they’re more powerful. In fusing, the mitochondria become temporarily more efficient and productive.
But when it comes to heart health 🫀, Vitamin C is wildly underrated. We think we understand it. But we don’t. And what I found when I dove into the science shocked me. (🔗 with all references at the end)
First, a quick hat-tip to what had me running down this rabbit hole. I recently wrote a newsletter on Lp(a) that was my most popular to date. I encourage you to check that out if you’re interested in heart health.
But here’s what you need to know: Lp(a) is like LDL’s evil twin—the one that went to villain school and graduated top of its class in blood clotting. And Lp(a) is that’s thought to be genetically cemented.
However, some people have had anecdotal success lowering Lp(a) with high-dose vitamin C supplementation.
Weird, right? But it got my curious and started down another rabbit hole. I’ve broken today’s newsletter into 8 chapters:
1. Vitamin C & Lp(a) – Nature’s substitution 2. Vitamin C & Heart Disease – The human data 3. Vitamin C & oxLDL – Can it stop cholesterol from turning toxic? 4. Vitamin C & Nitric Oxide – Why your blood vessels care 5. Mechanistic Summary – Piecing together the puzzle 6. Vitamin C Dosing – How much do you really need? 7. Vitamin C & Lysine – Batman & Robin 8. Puzzling Together the Protocol
2/8) Vitamin C and Lp(a)
Lp(a) is a spherical particle that floats around in the blood. It looks like an LDL particle, except Lp(a) also has a protein tail called apolipoprotein(a). This tail endows Lp(a) with the ability to promote blood clots and is one way in which Lp(a) is thought to promote cardiovascular disease, atherosclerosis.
But in 1990, the double Nobel Laureate Linus Pauling and his colleague Dr. Rath came up with an interesting idea about Lp(a). They hypothesized that Lp(a) was a surrogate for vitamin C.
Most mammals can synthesize their own vitamin C. But about 40 - 60 million years ago, our primate lineage developed a mutation in the GLO gene that prevents us from synthesizing vitamin C. Since vitamin C helps to promote wound healing, this would have placed an environmental pressure to develop an alternative means to promote wound healing and halt bleeding. In effect, evolution called for a substitute: Lp(a), which can likewise promote wound healing.
Now, if it were true that Lp(a) is an evolutionary substitute and surrogate for vitamin C, we might expect a pattern whereby animals that can synthesize vitamin C lack Lp(a). This is indeed the case!
What’s more, species that have also lost the ability to synthesize vitamin C, including guinea pigs and the European hedgehog, also produce Lp(a).
3/8) Across the animal kingdom, there’s a pattern: Where the ability to synthesize vitamin C remains, Lp(a) is missing. Where the ability to synthesize vitamin C is lost, Lp(a) is present. This provides one comparative evolution argument that Lp(a) is a surrogate for vitamin C.
But the intrigue doesn’t stop there. Chasing these observations, Pauling and Rath performed experiments where they deprived guinea pigs of vitamin C, which was sufficient to cause them to develop rapid atherosclerosis characterized by plaques filled with Lp(a). Conversely, when guinea pigs were given vitamin C, negligible amounts of Lp(a) could be found in their arteries.
☕How to Drink Coffee for Heart Health (Backed by Science)🫀🔗at the end (5/5)
1/5) What if I told you coffee was good for your heart?
Indeed, coffee isn’t just keeping you alive during Zoom meetings—it might actually be keeping you alive. In today’s letter, I’ll break down two human trials, one remarkable mouse study, the key molecule behind coffee’s heart benefits, how to dose and time your coffee for maximum impact, and what I enjoy even more than coffee these days.
First, let’s establish that there is a well-known association between coffee intake and reduced risk of cardiovascular disease—at least up to a point. But large-scale epidemiological studies provide limited insight on cause-effect relationships or mechanisms.
👉So, we turn to controlled trials and animal studies.
I want to review two human randomized controlled trials, and one fascinating animal study centered around a special chemical in coffee that is responsible for many of its health effects: chlorogenic acid.
If you follow me, you may recall chlorogenic acid from our discussions on how to stop sugar cravings or how the heart talks to the brain (these letters can be found at staycuriousmetabolism. com).
Briefly, it’s a well-studied polyphenolic compound enriched in coffee—especially lighter roasts, unroasted ‘green’ coffee, and Yerba Mate.
Let’s discuss two human randomized controlled trials. Both studies aimed to assess the effect of coffee and/or chlorogenic acid on vascular function. They measured vascular function using flow-mediated dilation (FMD), which evaluates the ability of the endothelium (the inner lining of blood vessels) to dilate in response to increased blood flow. It's a way to assess the health of blood vessels.
👉In one study, they gave participants one of two different coffees differing in chlorogenic acid content (89 mg or 310 mg), or a placebo control, and then measured FMD. As compared to the placebo, both coffees improved FMD, with the higher dose (310 mg) of chlorogenic acid appearing to have a larger effect.
To further prove it was the chlorogenic acid improving vascular function, they conducted another experiment in which they provided isolated chlorogenic acid rather than coffee. Again, the chlorogenic acid improved FMD.
👉These findings have been independently replicated. In another double-blinded randomized controlled trial, decaffeinated unroasted ‘green’ coffee containing chlorogenic acid at three different doses (302 mg, 604 mg, 906 mg) was compared to a placebo control for its effects on FMD. The chlorogenic acid significantly improved FMD versus placebo, although the higher doses did not provide additional benefit.
All in all, these studies suggest that chlorogenic acid in coffee improves vascular function.
3/5) But What About Long-Term Heart Health?🫀
Now, that’s interesting—and perhaps sufficient to justify your coffee habits. However, when it comes to long-term health, what you really want to know is whether chlorogenic acid could slow the progression of atherosclerosis, the buildup of plaque in your arteries.
Here, we can’t conduct human controlled trials because atherosclerosis takes too long to develop. Instead, we turn to animal models.
In what may be my favorite coffee-relevant paper to date, researchers gave ApoE-/- mice (predisposed to heart disease) a control diet or one supplemented with either 200 mg/kg chlorogenic acid, 400 mg/kg chlorogenic acid, or a statin (4 mg/kg atorvastatin).
Strikingly, chlorogenic acid reduced the progression of atherosclerosis at both doses, with the higher dose having the same effect size as the statin. You can see this clearly in the images on showing part of the heart with plaques circled, and in the bar graph showing atherosclerotic plaque area.
1/4) A few months ago, in March 2025, a randomized controlled trial was published that claimed to debunk the Carbohydrate Insulin Model (CIM).
In this study, 120 lean young adults (mean BMI 21-22) were assigned to one of three meals that varied in glycemic index (GI). All diets were 60% of calories from carbs, but the glycemic indices were 33, 65, and 73 for the low-, medium-, and high-GI meals, which were composed primarily of pasta or bread.
🍝Baseline: The day before the test meal, subjects were given a standard meal, buffet style, and allowed to eat as much as they wanted.
🍝Intervention: The next morning, they were given the intervention meal—either spaghetti pasta, buckwheat noodles, or steamed bread
🍝Test Meal: 5 hours later, they were given another buffet-style meal and again allowed to eat freely.
The researchers wanted to measure how much energy intake *changed* between the two buffet meals based on which intervention meal the participants received.
The CIM predicts that those who got the lower-GI intervention would have a smaller increase in calorie intake compared to those who ate the higher-GI meals.
To be crystal clear; “The primary, prespecified outcome in the registry (Clinicaltrials.gov: NCT05804942) was a change in energy intake between the baseline and test meals, powered to detect a 63 kcal group difference.”
So, what did they find?
*CC @davidludwigmd @AdrianSotoMota co-authors on letter to the editor
*All links (original paper, LTE, and reply to LTE) can be found in the newsletter version of the thread linked in 4/4
2/4) Indeed, the higher-GI diets led to larger increases in calorie intake: The low-GI group only increased by 17 calories; The medium- and high-GI groups increased by over 140 calories—more than double the effect size expected.
🤔So, why the discrepancy in interpretations?
i. First, the original research team feature an altered version of the primary outcome in stating there was “[n]o effect of GI on intake at [the] next meal.” This is a shift away from “change” in energy intake and omits the prespecified baseline, providing a notably less precise effect estimate than the more powerful change score.
ii. Second, they highlight the absence of group difference in subjective hunger ratings.
But subjective hunger is poorly correlated with objective food intake. If you’ve ever opened the fridge “just to look” and ended up eating half a cheesecake, you already know this.
To do our due diligence, we conducted an analysis and found no relationship between hunger ratings and food intake using their publicly available data.
3/4) iii. Third, the investigators emphasize the lack of associations between blood sugar after the meals and change in energy intake, as would be predicted by the CIM. But – and this is a subtle but important point, so take note – they include too much time after the meal. Most of the difference in blood sugar response between groups should occur occurred within the first ~2 hours, but they included 5 hours.
By way of simple analogy, if I force-fed you a Coke followed by Mentos and then insisted it didn’t cause gastrointestinal distress – a claim I suspect you’d contend – would it then be fair for me to counter that, “well, your stomach didn’t hurt at the 5 hour mark after I turned your GI system into an 8th grade science fair volcano.”
iv. Fourth, the original team note the lack of a “dose response,” with no difference in energy intake between the medium- and high-GI groups in post hoc analyses. However, even if the CIM specified a linear relationship between glycemic load and energy intake (it doesn’t), the contrast in GI between the low and moderate meals (33 versus 65) was much larger than between the moderate and high meals (65 versus 73).
This suggests the latter comparison is underpowered.
1/5) Obviously, the answer is many things. But an underappreciated truth is that behavioral states and emotions — including anxiety — can be the consequence of a metabolic state.
New data show how inflammation can act directly on the brain to promote (or soothe) anxiety. (link at the end)
2/5) The story of this study begins with an inflammatory molecule called 🔥IL-17🔥
IL-17 levels are increased in inflammatory disorders like psoriasis, inflammatory bowel diseases (ulcerative colitis and Crohn’s disease), rheumatoid arthritis, and ankylosing spondylitis.
👉It’s certainly relevant to humans. But to prove a causal connection between IL-17 and anxiety, researchers turned to animal models. Researchers treated mice with a chemical that increases IL-17 levels.
This made the mice more anxious on three different validated behavioral tests.
3/5) Next, to connect the dots, the researchers looked for IL-17 receptors in the brain.
Indeed, they found that IL-17 receptors were concentrated in the anxiety center of the brain, the basolateral amygdala.
👉And they found that directly administering IL-17 into the brain induced anxiety.
💡Furthermore, chemically turning “on” or “off” the neurons in the basolateral amygdala that harbored IL-17 receptors turned anxiety “on” or “off” in the animals, respectively.
This strongly suggests that neurons in the basolateral amygdala can cause anxiety — and that increasing levels of the inflammatory signaling molecule IL-17 activates these neurons to promote anxiety.
🍭The Sugar Diet Works—But Not for the Reason You Think❌ You win comments section.
On (extremely) popular demand, I decided to cover this viral trend #SugarDiet. What I discovered surprised me. You can find a link to a newsletter with more details at the end, but let’s review some of the data. 1/7) What is the Sugar Diet? If you haven’t been following. The sugar diet is defined by eating low-protein, low-fat and lots of carbs.
As an example, @MarkSmellyBell has been on the sugar diet for several weeks and eating ~0.5 grams of protein per pound of body weight (~100 grams at 209 lbs), keeping fat <30 grams and eating as much as 800 grams of sugary carbs per day. If we use the numbers 100g protein, 30g fat and 800g carbs that’s 3,870 Calories, with 83% from carbs.
He’s also including “sugar fasts” on top of his sugar diet, where for days at a time he’ll consume only these six foods: fruit, fruit juice, maple syrup, honey, sugar, and candy But he’s reporting rapid weight loss. And others are reporting similar. So, should you believe them, or are they just lying on behalf of Big Jellybean? Let’s discuss some important data, then you can decide for yourself. #sugardiet #metabolichealth #educational #staycurious #FGF21
cc @hubermanlab + @GardnerPhD re protein requirements. Andrew noted you have different perspectives on optimal protein intake on your recent May 12, 2025 HLP podcast. These Nat Metabolism data may provide an unexpected source of intellectual reconciliation @R_Mohr
@MikeMutzel @Physionic_PhD @drmarkhyman, I figure this is of general interest to you
@drgabriellelyon re protein restriction, invited comment
2/7) The Data
The study that captured my attention was recently published in Nature Metabolism. It investigated the effects of a low-protein, high-carb diet on energy expenditure. The subjects were healthy young men in their mid-20s, mean BMI ~25 kg/m2, who were placed on a diet that was **9% protein and 70% carbs** as percent of calories for five weeks, before reverting to a higher protein diet (18% protein) for the following five weeks.
🔥Remarkably, after about a week on the low-protein, high-carb diet the participants needed to increase their energy intake to maintain body weight.
By week five, they’d increased energy intake by **19% (574 Calories per day)** but had lost 1.0 kg. This 574 Calorie increase in energy intake while losing 1.0 kg occurred without a significant change in muscle mass and without an increase in physical activity.
They also replicated the low-protein, high-carb diet results on another set of young men. Again, energy intake needed to be increased by 20% to maintain weight, without any increase in physical activity.
3/7) High Carbs or Low Protein?
Finally, they asked whether swapping some of the carbs for fat changed the result by conducting a third similar study, but one in which protein was 9% and fat was more than doubled to 50%, while carbs were chopped down to 41%.
✋Pause and make a prediction.
If it was the power of carbs and sugar accounting for the metabolic boost, you’d expect swapping carbs for fat would reduce the benefit. But, if it were the protein restriction that was responsible for the increased energy expenditure, you’d expect the same results as in the other studies.
Question: Can you guess what happened?
Answer: On the protein-restricted higher fat diet, the results were the same, namely that participants needed to eat 21% more Calories per day by the end of week five to maintain their weight. And, again, there was no change in physical activity.
Thus, something about the protein restriction was causing these folks to burn off more energy.