Karen Cutter Profile picture
Jan 19 17 tweets 5 min read
NSW Health has released their epi report for the week ending 14 Jan. As I've been away for a while, this thread covers the last six weeks or so.
#Covid19Aus #Covid19NSW
You can find the full report here...
health.nsw.gov.au/Infectious/cov…
Note that for the two weeks ending 31 Dec, NSW Health reported a lot of metrics for these two weeks combined. So I have needed to estimate the split between the two weeks in some places.
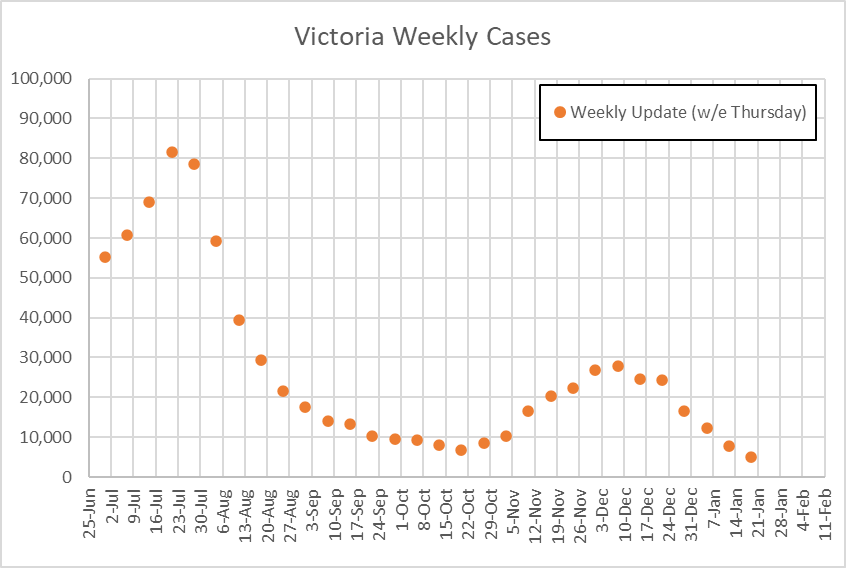
In the most recent wave, cases grew quite steadily up until around 10 Dec, then we had a dramatic decline (-40%) in the week ending 31 Dec (a week that includes Christmas day and boxing day). The last two weeks have seen 30% reductions in cases. Image
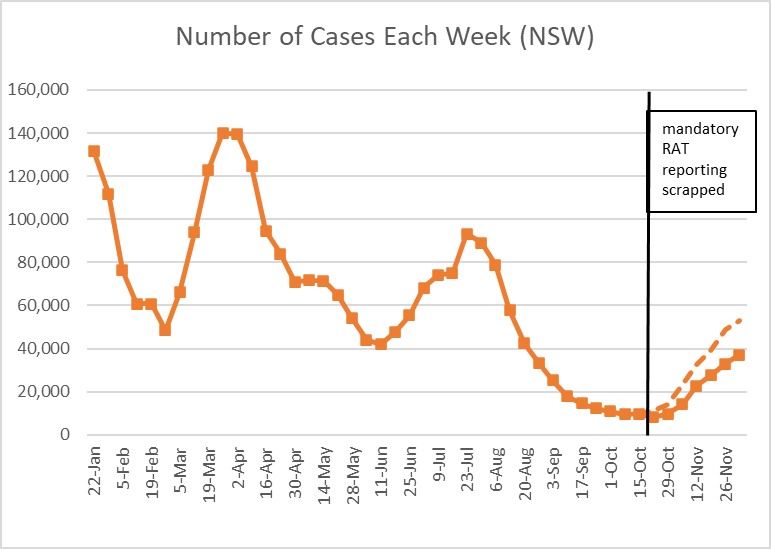
PCR vs RAT cases: removing mandatory reporting of RATS resulted in an undercount of RATs relative to the previous wave.
The requirement for a doctor referral to get a PCR test since 1 Jan has reduced the number of PCR cases. RAT and PCR cases are now similar again. Image
It is very difficult/impossible to really understand the trend in case numbers in the last few weeks given the impact of Christmas, plus changes to access for PCR tests.
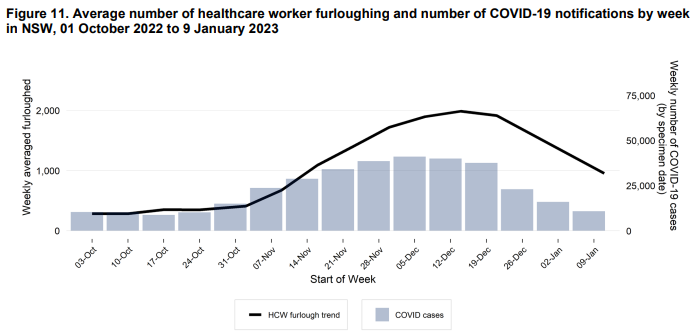
Healthcare workers furloughed (an early indicator of case trends) is on the decline, but the shape doesnt have the same big drop in the w/e 31 Dec as the cases graph.
This indicates prevalence is now similar to w/e 14 Nov, whereas the cases graph would indicate 29 Oct. Image
In good news, PCR positivity has reduced in the last three weeks. But still terribly high at 13%. Image
Cases by age band: loads more recorded cases in 60+ age band in this wave. And a lot less cases recorded in kids. Image
Hospital admissions have been falling for the last 3 weeks Image
The epi report no longer reports on how many people are in hospital.
Wrapping up 2022, this graph shows a breakdown of hospital/ICU admissions by age band since 22 May (when we have data). 20% of hospital admissions were in those aged under 40.
This age mix has been pretty consistent over the year. Image
There were 120 deaths recorded this week. Image
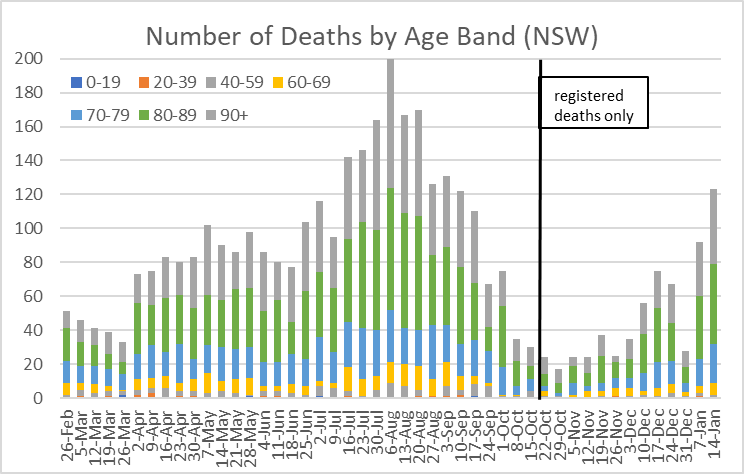
And here is the age mix of deaths from 22 May to 31 Dec.
Of the 4,622 covid deaths in the year, 29 were in people aged under 40. Image
Our homegrown BR.2 sublineage has been dominant over the last six weeks or so.
XBF has had some recent growth.
ends/ Image
A correction to this thread: PCR testing in NSW is still available without a GP referral. So it is unclear why PCR case numbers have dropped so much. Yes, there would have been a real reduction in cases, but the quantum appears too high…
Maybe people were like me and thought it had been implemented in NSW, so aren’t seeking PCR tests?
This should say 11%, not 13%. I incorrectly quoted last week’s positivity rate.

• • •

Missing some Tweet in this thread? You can try to force a refresh
 

Keep Current with Karen Cutter

Karen Cutter Profile picture

Stay in touch and get notified when new unrolls are available from this author!

Read all threads

This Thread may be Removed Anytime!

PDF

Twitter may remove this content at anytime! Save it as PDF for later use!

Try unrolling a thread yourself!

how to unroll video
  1. Follow @ThreadReaderApp to mention us!

  2. From a Twitter thread mention us with a keyword "unroll"
@threadreaderapp unroll

Practice here first or read more on our help page!

More from @KarenCutter4

Jan 21
A thread on Australian covid deaths. Some overall stats for Australia as a whole, then looking at the vexed question of why Vic deaths look higher than NSW.
TLDR: this thread raises more questions than it answers
First, surveillance deaths by date of report. This graph shows the number of deaths reported by each state in their (now) weekly updates. It includes all deaths where the the person died with or from covid (excluding trauma deaths and the like where covid clearly not a factor). Image
Second, surveillance deaths by date of occurrence. This is based on data fed by the states into the National Notifiable Diseases Surveillance System (NNDSS). There are delays in deaths reported by the states appearing in this database. Image
Read 20 tweets
Jan 19
NSW and Vic have released their weekly updates.
Short thread putting the numbers into context. ImageImage
Cases are down 36% (NSW) and 38% (Vic) compared with last week ImageImage
People in hospital are down 15% (NSW) and 28% (Vic).
For NSW, the peak in people in hospital this wave reached about 75% of the peak of the July wave. For Victoria equivalent was 85%. Note differences in hospital definitions mean this is not a like-for-like comparison. ImageImage
Read 4 tweets
Dec 8, 2022
The NSW Health epi report for the week ending 3 December is now out.
A thread/
#Covid19Aus #Covid19NSW
You can find the full report here...
health.nsw.gov.au/Infectious/cov…
Reported cases are up 13% this week, a bit of a slowing in the rate of growth.
I've also estimated case numbers had mandatory reporting of RATS continued (dashed line). Approx 53,000 cases compared with 37,000 actual.
NSW Health has included a graph of furloughed health care workers, which provided a good correlation to case numbers prior to scrapping mandatory RAT reporting.
Hard to read off this graph, but it indicates maybe 55,000 cases had RAT reporting continued, so similar
Read 12 tweets
Dec 7, 2022
The latest NSW COVID-19 Risk Monitoring Dashboard is out, with data to 5 December.
Short thread/
You can find it here...
aci.health.nsw.gov.au/__data/assets/…
Growth in weekly cases has slowed a little (+11% versus +18-19% in the two previous weeks)
Growth in the number of people in hospital has also slowed (+6% versus 14-16% in the previous two weeks).

ends/
Read 4 tweets
Dec 6, 2022
The COVID-19 Mortality Working Group of the Actuaries Institute released an update of our excess mortality analysis today, covering detailed ABS data to 31 August 2022.
#COVID19Aus #ExcessMortality
Strap in folks, this is a long one... Image
(The blog has not quite been published yet. But I have things to do and needed to get this thread done. I'll link the blog at the end once it is published.)
As always, our excess deaths are measured relative to pre-pandemic expectations of mortality, including allowance for:
- changes in population size and age mix
- continuation of pre-pandemic mortality trends.
Read 27 tweets
Dec 1, 2022
The NSW Health epi report for the week ending 26 Nov is now out.
A thread, where I get cranky (again)/
#Covid19Aus #Covid19NSW
You can find the full report here...
health.nsw.gov.au/Infectious/cov…
Cases up 19% in the week. As mandatory reporting of RATs was discontinued on 14 Oct, cases since then are not comparable to the earlier timeseries
Here are cases split between PCR and RATs. A rough estimate is that if RATs were still mandatory, we'd be pushing around 50,000 cases this week (rather than 33,000). (@dbRaevn usually does a more accurate estimate, utilising the info by age band.)
Read 12 tweets

Did Thread Reader help you today?

Support us! We are indie developers!


This site is made by just two indie developers on a laptop doing marketing, support and development! Read more about the story.

Become a Premium Member ($3/month or $30/year) and get exclusive features!

Become Premium

Don't want to be a Premium member but still want to support us?

Make a small donation by buying us coffee ($5) or help with server cost ($10)

Donate via Paypal

Or Donate anonymously using crypto!

Ethereum

0xfe58350B80634f60Fa6Dc149a72b4DFbc17D341E copy

Bitcoin

3ATGMxNzCUFzxpMCHL5sWSt4DVtS8UqXpi copy

Thank you for your support!

Follow Us on Twitter!

:(