Thread: True Strength Index (TSI) Indicator
A combination of momentum (leading) and smoothing (lagging) qualities.
(1/20)
#Indicator #trading #investing #definedge
A combination of momentum (leading) and smoothing (lagging) qualities.
(1/20)
#Indicator #trading #investing #definedge

A momentum indicator developed by William Blau, the True Strength Index (TSI) measures a stock's strength.
In general, momentum indicators are aggressive, while smooth indicators are lagging. Both have their advantages & disadvantages.
In general, momentum indicators are aggressive, while smooth indicators are lagging. Both have their advantages & disadvantages.
However, aggressive indicators are leading but they often result in frequent shifts. Smoothed indicators are lagging, but they are relatively stable.
TSI is a helpful indicator for strength analysis that combines momentum & the smoothing factor.
Let me explain.
TSI is a helpful indicator for strength analysis that combines momentum & the smoothing factor.
Let me explain.
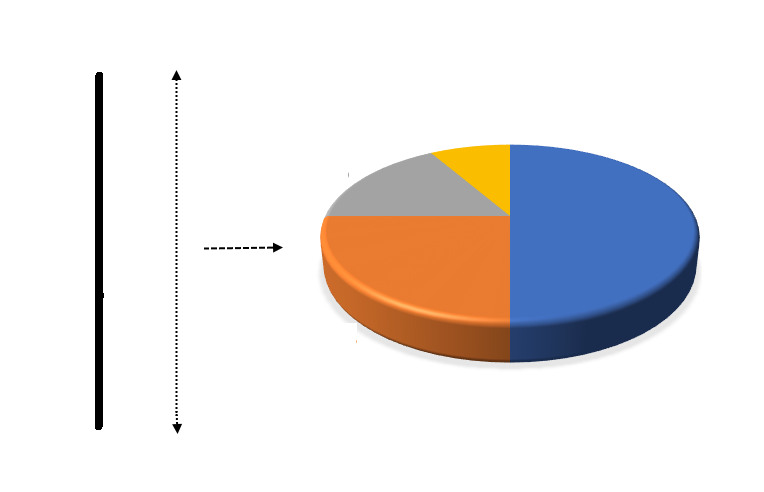
Below image shows the daily fluctuation in the price of 4 sessions.
1: Price was up by 10 points (10)
2: Down by 5 points (-5)
3: Up by 10 points (10)
4: Down by 10 points (-10)
You can call it daily fluctuation, daily return, rate of change, performance, momentum, or trend.
1: Price was up by 10 points (10)
2: Down by 5 points (-5)
3: Up by 10 points (10)
4: Down by 10 points (-10)
You can call it daily fluctuation, daily return, rate of change, performance, momentum, or trend.

Price movement that is higher than it is falling over the course of a period indicates that the trend is strong.
The daily return is the first component of the TSI.
As these daily returns would be noisy and random, they are smoothed using an exponential moving average (EMA).
The daily return is the first component of the TSI.
As these daily returns would be noisy and random, they are smoothed using an exponential moving average (EMA).
There are two steps:
A = 25-period EMA of daily returns
B = 13-period (Half of 25) EMA of A
This is a double smoothing of daily returns.
Let’s move to the next component.
A = 25-period EMA of daily returns
B = 13-period (Half of 25) EMA of A
This is a double smoothing of daily returns.
Let’s move to the next component.
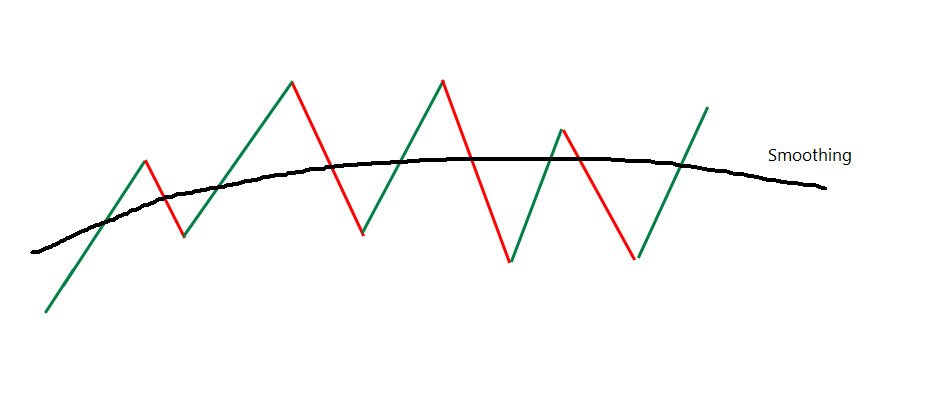
Daily fluctuation also shows the volatility of the stock.
See the image.
1. Price moved by 10 points
2. Moved by 5 points
3. Moved by 10 points
4. Moved by 10 points
Regardless of the trend, it shows the magnitude of price movement. It shows the volatility of the instrument.
See the image.
1. Price moved by 10 points
2. Moved by 5 points
3. Moved by 10 points
4. Moved by 10 points
Regardless of the trend, it shows the magnitude of price movement. It shows the volatility of the instrument.

Daily volatility is the second component of the TSI indicator.
This will also be noisy. Hence, double smoothing is applied to volatility too.
A1 = 25-period EMA of daily volatility
B1 = 13-period (Half of 25) EMA of A1
Final part:
This will also be noisy. Hence, double smoothing is applied to volatility too.
A1 = 25-period EMA of daily volatility
B1 = 13-period (Half of 25) EMA of A1
Final part:
B is trend and B1 is volatility. Noise is removed from both using EMA.
How about trend divided by volatility?
It will show us the ratio of trend versus volatility. If the trend compared to volatility is strong, the ratio will be high.
So, TSI = (B / B1) x 100
How about trend divided by volatility?
It will show us the ratio of trend versus volatility. If the trend compared to volatility is strong, the ratio will be high.
So, TSI = (B / B1) x 100
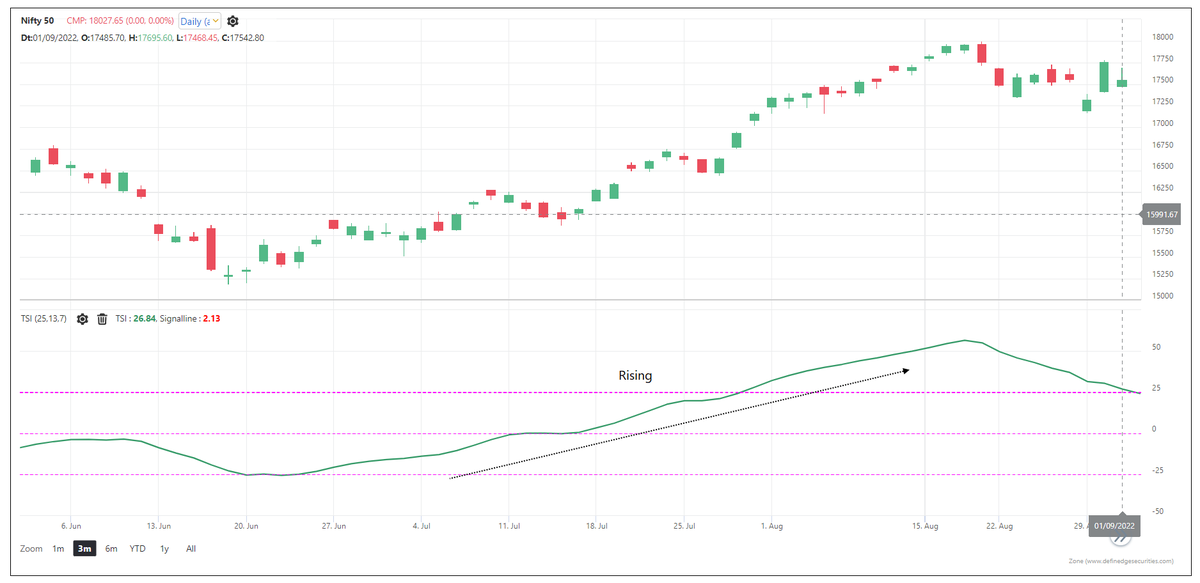
Thus, the rising TSI line indicates that the trend is bullish and is stronger than volatility. A falling TSI line is bearish.
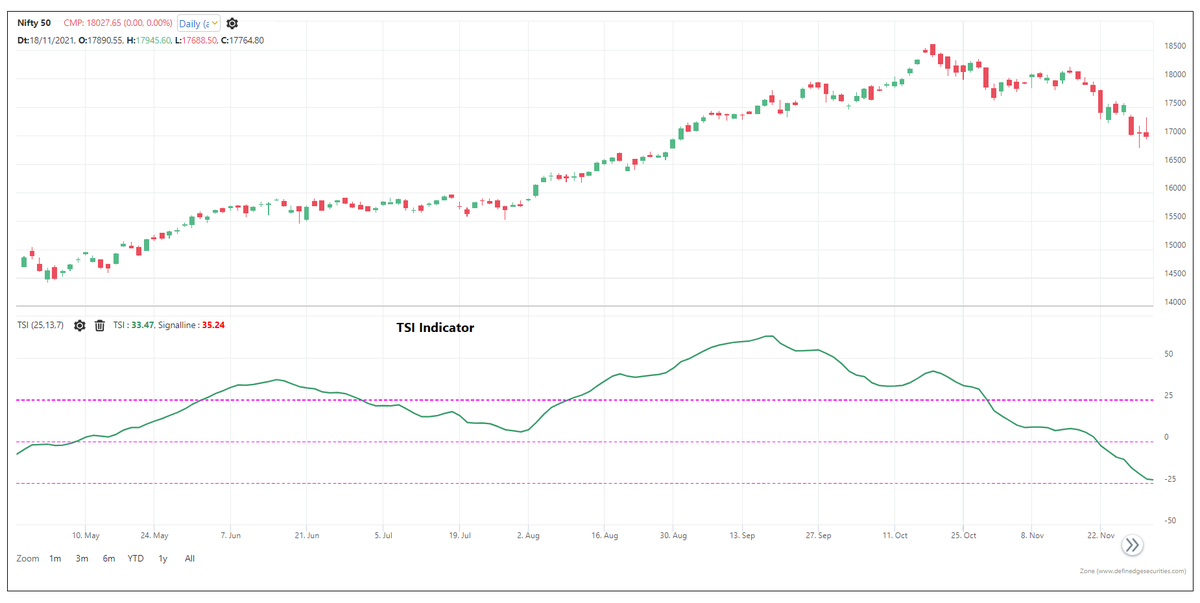
There are three key readings of this indicator: overbought – oversold, zero line and signal line.
There are three key readings of this indicator: overbought – oversold, zero line and signal line.
The indicator fluctuates between +100 & -100.
As Blau recommended, +25 is an overbought level, while -25 is an oversold level, since most indicator readings will fall within these levels.
However, OB - OS levels are dependent on the market trend and the instrument as well.
As Blau recommended, +25 is an overbought level, while -25 is an oversold level, since most indicator readings will fall within these levels.
However, OB - OS levels are dependent on the market trend and the instrument as well.

TSI above zero indicates that the trend is greater than the volatility, so it is bullish when TSI is above zero, and bearish when TSI is below zero.
In my opinion, the signal line is more useful for this indicator.
In my opinion, the signal line is more useful for this indicator.

A 7-period (half of 13) EMA of the TSI is a signal line.
If the TSI line crosses the signal line from below (bullish crossover), it indicates that the trend is turning bullish.
When there is a bearish crossover, it indicates that the trend is turning bearish.
If the TSI line crosses the signal line from below (bullish crossover), it indicates that the trend is turning bullish.
When there is a bearish crossover, it indicates that the trend is turning bearish.

A rising gap between the TSI & signal line is more bullish when the TSI is above the signal line. An increasing gap below the signal line is more bearish.
Bullish crossover from oversold levels & the bearish crossover from overbought levels can be effective, in rangebound mkts.
Bullish crossover from oversold levels & the bearish crossover from overbought levels can be effective, in rangebound mkts.

Bullish and bearish crossovers of this indicator are useful.
When the TSI is above the average line, look for bullish breakouts, pullbacks, and patterns.
When the TSI is below its average line, look for bearish patterns, breakouts, and pullbacks.
When the TSI is above the average line, look for bullish breakouts, pullbacks, and patterns.
When the TSI is below its average line, look for bearish patterns, breakouts, and pullbacks.
Generally, I avoid smoothing indicators since they tend to lag significantly.
Smoothing the daily fluctuations makes this indicator a decent momentum indicator, even after having a double smoothing effect applied.
Blau recommends the 25, 13 & 7 periods for the TSI.
Smoothing the daily fluctuations makes this indicator a decent momentum indicator, even after having a double smoothing effect applied.
Blau recommends the 25, 13 & 7 periods for the TSI.
The indicator works on all timeframes.
25-EMA reduces noise of daily returns, while 13-EMA smooths them out. EMA emphasizes recent data & reduces the time lag. A combination of short-term strength & the benefits of lagging indicator. Daily returns & double smoothing is brilliant
25-EMA reduces noise of daily returns, while 13-EMA smooths them out. EMA emphasizes recent data & reduces the time lag. A combination of short-term strength & the benefits of lagging indicator. Daily returns & double smoothing is brilliant
Found it v effective on P&F charts (noiseless data).For P&F, the daily returns will be the returns of each column, i.e. the return for each swing move.
Smoothing the returns and volatility of swing moves is a fascinating concept.
Smoothing the returns and volatility of swing moves is a fascinating concept.

The P&F price patterns are among my favorite studies, and I believe they are the very useful for price action analysis.
It is the purpose of this post to discuss the logic behind the indicator.
Do not interrupt your current studies and strategies when you learn something new.
It is the purpose of this post to discuss the logic behind the indicator.
Do not interrupt your current studies and strategies when you learn something new.
Analyze and observe. It may or may not work for you. You may gain additional insight by reflecting on my explanation of the indicator.
Hope you learned something of value and found the thread informative.
Keep learning and evolving.
<end of thread>
Hope you learned something of value and found the thread informative.
Keep learning and evolving.
<end of thread>
• • •
Missing some Tweet in this thread? You can try to
force a refresh