
I studied & decoded every #Budget from 2012 - 2022 so that you don't have to.
Interestingly every #Budget has a pattern, which needs to be cracked. So i did it for you !
Like and retweet appreciated : telegram.me/chartians
Detailed explanation below 👇👇
#Budget2023
Interestingly every #Budget has a pattern, which needs to be cracked. So i did it for you !
Like and retweet appreciated : telegram.me/chartians
Detailed explanation below 👇👇
#Budget2023

Budgets under Modi Regime and their returns.
Arun Jaitley - 2014 :: 2018 (-0.23, 0.65, -0.61, 1.81, -0.10)
Nirmala Sitharaman - 2019 :: 2022 (-1.14, -2.51, 4.74, 1.16)
Arun Jaitley - 2014 :: 2018 (-0.23, 0.65, -0.61, 1.81, -0.10)
Nirmala Sitharaman - 2019 :: 2022 (-1.14, -2.51, 4.74, 1.16)


Some more facts !


Some more facts here :


1,00,000 invested on Budget day and held on till the next Budget gave you following returns :
2012/13 : 13.11%
2013/14 : 0.40%
2014/15 : 51%
2015/16 : -18%
2016/17 : 15%
2017/18 : 28%
2018/19 : 0.26%
2019/20 : 5.75%
2020/21 : 23%
2021/22 : 20.72%
2012/13 : 13.11%
2013/14 : 0.40%
2014/15 : 51%
2015/16 : -18%
2016/17 : 15%
2017/18 : 28%
2018/19 : 0.26%
2019/20 : 5.75%
2020/21 : 23%
2021/22 : 20.72%
Budgets have been of a silent nature historically, the main game begins after budget or the game is over before the budget !
So lets see year by year data below !
So lets see year by year data below !
#Budget2012
1. Markets had straight 6 weeks of incline gaining 17% but later corrected the 14% gains.
2. Interesting part was that, market came out of bear grip after nearly 2 years.
1. Markets had straight 6 weeks of incline gaining 17% but later corrected the 14% gains.
2. Interesting part was that, market came out of bear grip after nearly 2 years.

#Budget2013
1. This year markets saw a major top and corrected nearly 17% from 2013 budget to September 2013.
2. If you had invested 1Lac on 2013 Budget day, you would be sitting with 0.36% returns (less than FD)
1. This year markets saw a major top and corrected nearly 17% from 2013 budget to September 2013.
2. If you had invested 1Lac on 2013 Budget day, you would be sitting with 0.36% returns (less than FD)

#Budget2014
The budgets ka baap, also because newly elected Modi regime took over.
This budget delivered probably the highest returns close to around 50% till the next budget.
The budgets ka baap, also because newly elected Modi regime took over.
This budget delivered probably the highest returns close to around 50% till the next budget.

#Budget2015
This budget delivered negative returns of 18% till the next budget.
If you traded this year then you must remember 24/08/2015 market dip, where we saw a 6% down day
This budget delivered negative returns of 18% till the next budget.
If you traded this year then you must remember 24/08/2015 market dip, where we saw a 6% down day

#Budget2016
Markets bottomed out and went on to deliver around 26%
This was also the year of URI strike and the infamous Demonetization of currency !
Markets bottomed out and went on to deliver around 26%
This was also the year of URI strike and the infamous Demonetization of currency !

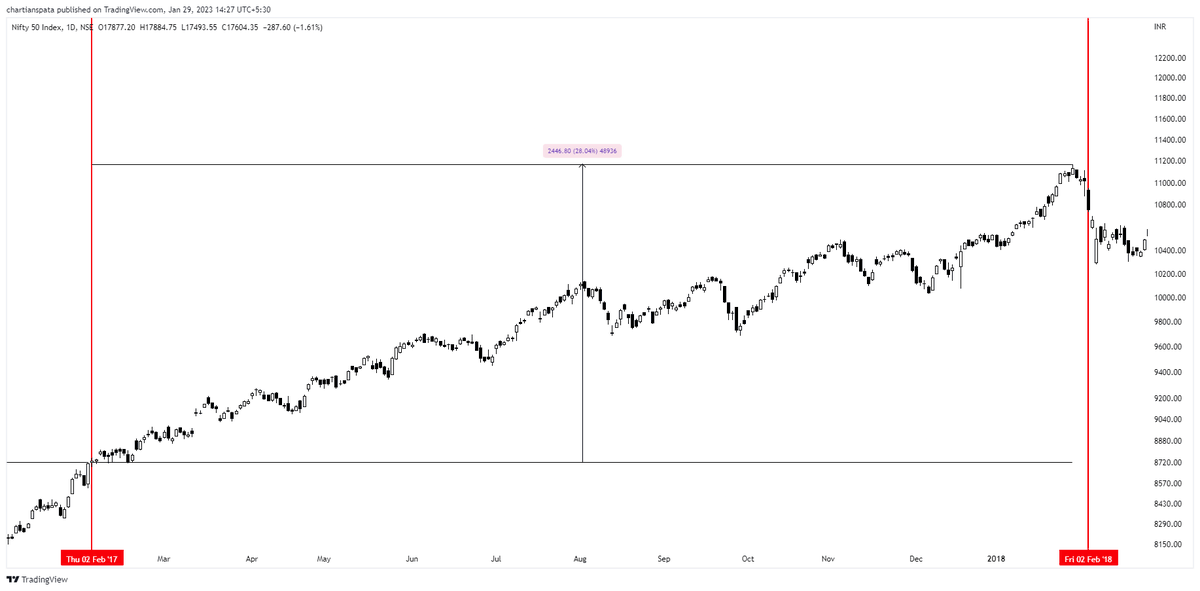
#Budget2017
The flattest budget day with a nearly 28% rise on the indices.
Markets in 2018 went on to top out and correct till March 2018
The flattest budget day with a nearly 28% rise on the indices.
Markets in 2018 went on to top out and correct till March 2018


Before going ahead and trading on #Budget day here are some tips :
1. Crisp risk management will decide your fate
2. Option buyers to stay away as every move will be against you
3. Stock specific action will be inflated by news, so prefer to do positional with half the risk
1. Crisp risk management will decide your fate
2. Option buyers to stay away as every move will be against you
3. Stock specific action will be inflated by news, so prefer to do positional with half the risk
If you have come till here dont forget to join our telegram.me/chartians channel where nearly 23,000 traders interact daily !
Our instagram is loaded with 30 seconds reels everyday : instagram.com/tradingcoachch…
Our instagram is loaded with 30 seconds reels everyday : instagram.com/tradingcoachch…
Like and retweet this original tweet for more such fine tuned content :
https://twitter.com/chartians/status/1619653313410265088
• • •
Missing some Tweet in this thread? You can try to
force a refresh


