Equitymaster Profile picture
Feb 1 11 tweets 11 min read
What is Moving Average in Technical Analysis and why it is important to identify market trends? Our ace chartist @bbrijesh decodes the ways to implement Moving Averages. #TechnicalAnalysis
The moving average #MA is a simple technical analysis tool that smoothens the price data by creating a constantly updated average price. It can be applied on various time-frames like minutes, hours, days, weeks, months, quarters, and even years.
There are 3 types of #MA. 1) Simple Moving Average #SMA. 2) Exponential Moving Average #EMA. 3) Weighted Moving Average #WMA. The #SMA and #EMA are the widely used moving averages.
The popular moving averages' lenghts or periods are 20, 50, 100, and 200 periods on hourly, daily, and weekly charts. But should you use a default #MA?
I prefer a customized #MA on different instruments. Look at 2 charts with the same MA. On Nifty(Daily), I use 235 days #EMA which seems weird to many but it has fewer whipsaws. But the 235 #EMA on the FMCG index has many whipsaws. Tip: Always use the #MA which has fewer whipsaws
Trend Identification using #MA: 1) Bullish - When the price is trading above the #MA. 2) Bearish - When the price is trading below the #MA. Traders use multiple #MA to identify the trend.
#MA Crossover Strategy is widely used by traders. Golden Cross and Death Cross are well-know strategies. 1) Golden Cross is termed #BULLISH when the #50SMA crosses above the #200SMA. 2) Death Cross is termed #BEARISH when the #50SMA crosses below the #200SMA.
Advantages of #MA: 1) Trend identification. 2) Plotting supports and resistances. 3) Helps to ride a big trend while upgrading stop-losses at regular intervals. 4) Can use multiple #MA on multiple time frames. 5) Easy to implement.
Disadvantages of #MA: 1) Lagging indicator as confirmation of the reversal is late. 2. Confusion due to multiple #MA. 3) Whipsaws in rangebound markets. 4) Not a good indicator for reversal traders.
#MA Crossover Strategy is widely followed by traders. Golden Cross and Death Cross are well-know strategies. 1. Golden Cross is termed #BULLISH when #50SMA crosses above #200SMA. 2. Death Cross is termed #BEARISH when #50SMA crosses below #200SMA.
#Comment on your best #MA or your trading strategy using multiple #MA. To keep track of what’s happening on the charts, you can follow Brijesh on his Telegram channel t.me/FastProfitsRep… and watch his videos on eqtm.in/Jd93Z

• • •

Missing some Tweet in this thread? You can try to force a refresh
 

Keep Current with Equitymaster

Equitymaster Profile picture

Stay in touch and get notified when new unrolls are available from this author!

Read all threads

This Thread may be Removed Anytime!

PDF

Twitter may remove this content at anytime! Save it as PDF for later use!

Try unrolling a thread yourself!

how to unroll video
  1. Follow @ThreadReaderApp to mention us!

  2. From a Twitter thread mention us with a keyword "unroll"
@threadreaderapp unroll

Practice here first or read more on our help page!

More from @Equitymaster

Jan 30
As per Richa Agarwal, editor of our smallcap recommendation service Hidden Treasure, a huge structural shift is unfolding in the Indian economy that could create significant wealth for companies in India, and for the investors in them. Here's more from Richa:
India is undergoing structural shift that could benefit many Indian companies across sectors. I’m referring to the shifting supply chains in the post-pandemic era. These shifts were always happening but at a much gradual place. They have picked up the pace for three key reasons.
First- During and post Covid, the global companies with over-reliance on one supplier, specifically China, saw their supply chains breaking, and their prospects dwindling. With this shake up, the corporates are consciously deciding to diversify and broaden outsourcing.
Read 10 tweets
Jan 24
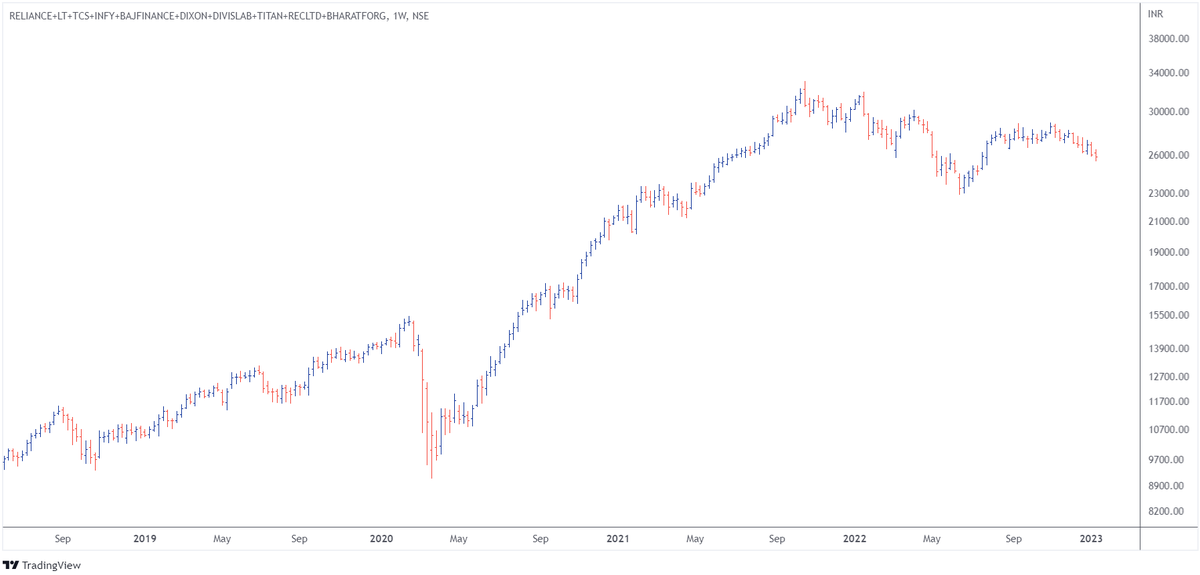
Our ace chartist @bbrijesh posts the Index chart in his video. Let us understand on how he creates this index in Tradingview to analyze the charts. #Index #TechnicalAnalysis #charting
There are 2 ways to create an index - Equal Weighted Index #EWI and Market Cap Index #MCI. 1. EWI is used when maximum stocks are from large and midcap. 2. MCI is used when max stocks are midcap and smallcap.
To plot EWI, the stock price is just added and it is plotted on the chart. For Eg. I have taken 10 stocks - #Reliance #LT #TCS #Infy #BajFin #Dixon #DivisLab #Titan #RECLtd #BharatForg Check #chart attached
Read 8 tweets
Jan 22
Smallcaps have a reputation of being risky, unlike their bigger peers. However, Richa Agarwal, Editor of Hidden Treasure (Equitymaster's smallcap recommendation service) and her team, have broken this myth. #smallcapstocks
Since inception in Feb 2008 until September 22, the verified IRR (Internal rate of return) for Hidden Treasureis at 26.9%, beating benchmark indices by almost 3x.Here's is what I expect for smallcaps in 2023. #SmallcapMultibaggers #topsmallcapsfor2023
Some reflections first…2022 was a challenging year with Russia Ukraine war, supply chain disruptions, inflationary pressures, tech meltdown, slowdown in global economies and locks downs in China. And the rough ride is not over.
Read 19 tweets

Did Thread Reader help you today?

Support us! We are indie developers!


This site is made by just two indie developers on a laptop doing marketing, support and development! Read more about the story.

Become a Premium Member ($3/month or $30/year) and get exclusive features!

Become Premium

Don't want to be a Premium member but still want to support us?

Make a small donation by buying us coffee ($5) or help with server cost ($10)

Donate via Paypal

Or Donate anonymously using crypto!

Ethereum

0xfe58350B80634f60Fa6Dc149a72b4DFbc17D341E copy

Bitcoin

3ATGMxNzCUFzxpMCHL5sWSt4DVtS8UqXpi copy

Thank you for your support!

Follow Us on Twitter!

:(