Time for another weekend analysis.
This time I want to start with $dxy
As we were expecting, $dxy looks like it finally found support and bounced
Here is the scenario we were looking for:
I still believe it's likely $dxy will rise towards the 107 area
This time I want to start with $dxy
As we were expecting, $dxy looks like it finally found support and bounced
Here is the scenario we were looking for:
I still believe it's likely $dxy will rise towards the 107 area

This rise in $dxy would, on average, be correlated with weakness in $spx and $btc
$spx had a bullish week, only to close bearish on Friday b/c of earning reports
ATM, I believe $4,200 is resistance for $spx
$4,100 is support
we may be in for ranging PA next week
$spx had a bullish week, only to close bearish on Friday b/c of earning reports
ATM, I believe $4,200 is resistance for $spx
$4,100 is support
we may be in for ranging PA next week

As we were expecting, $dji had a ranging week
between 34,364 and 33,792
ATM, until we confirm a break above 34,364 I think it's really like ranging PA will continue
between 34,364 and 33,792
ATM, until we confirm a break above 34,364 I think it's really like ranging PA will continue
BTW, did u know that most traders are STUCK in beginner mode?
If u wanna know your (realistic!) chances of
💰makin' money in this market💰
check out this fun little quiz I've got for ya:
bit.ly/crypto-quiz_bcw 👇🔥
If u wanna know your (realistic!) chances of
💰makin' money in this market💰
check out this fun little quiz I've got for ya:
bit.ly/crypto-quiz_bcw 👇🔥
Here's what $dji looked like on the 1D:

And now... our big daddy $bitc #Bitcoin
Nothing much changed on the daily
Still observing the levels and area we had marked on our charts...
We got rejected right from red zone #1, and now we're ranging
IMHO, I believe $btc is accumulating for another push higher
Nothing much changed on the daily
Still observing the levels and area we had marked on our charts...
We got rejected right from red zone #1, and now we're ranging
IMHO, I believe $btc is accumulating for another push higher

The scenario I'm looking for is something like this:
$24,400 is the VAH of the volume profile of the entire 2022 bear
I think we touch at least upon $24,400
With a high likelyhood of $24,800 - $25,200
From there we may see a deeper correction
Again, this is just a possiblity
$24,400 is the VAH of the volume profile of the entire 2022 bear
I think we touch at least upon $24,400
With a high likelyhood of $24,800 - $25,200
From there we may see a deeper correction
Again, this is just a possiblity

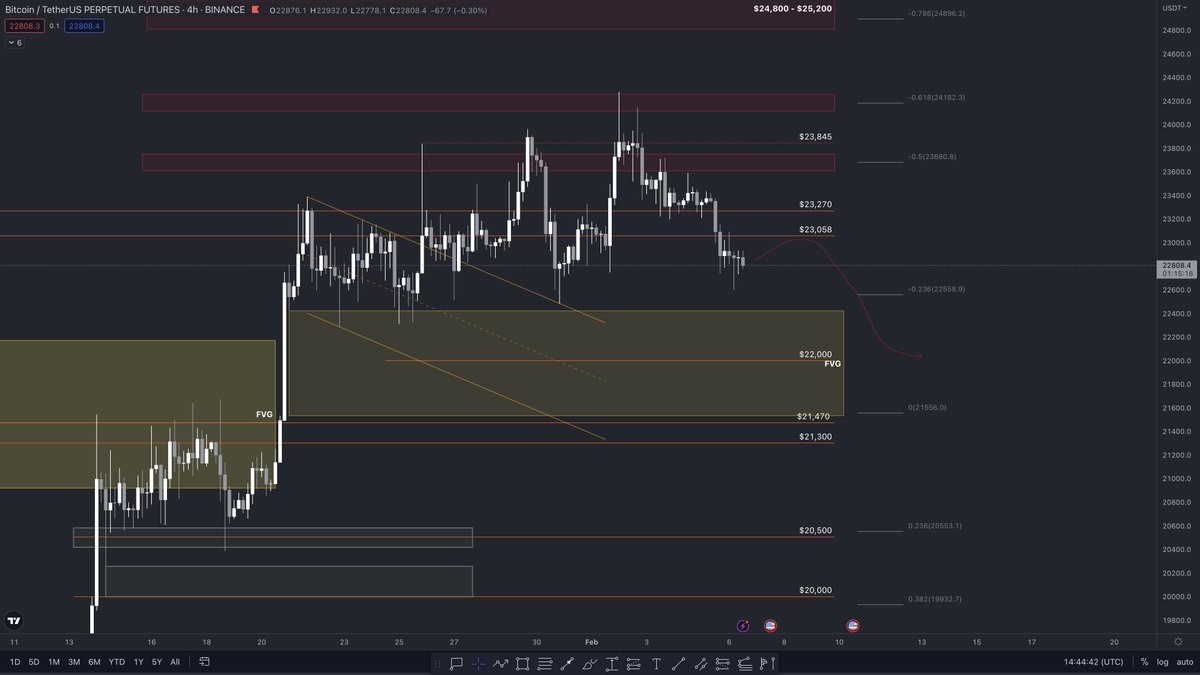
On the 4H, what we were watching for was smth like this:
ATM, $btc #bitcoin seems to following this path rather well
on the 4H, $23,270 held as support
ANY bearish scenario start swith:
4H close below $24,270 confirming loss of support
Otherwise, we're likely going higher
ATM, $btc #bitcoin seems to following this path rather well
on the 4H, $23,270 held as support
ANY bearish scenario start swith:
4H close below $24,270 confirming loss of support
Otherwise, we're likely going higher

A confirmation of the likelyhood of $btc going higher is
4H Close above $23,610
This is just IMHO, of course, and therefore just a probability to oberserve and analyise
Tomorrow, Sunday, will give us more clarity on the next moves
for $btc, $egld and the #cryptomarket
4H Close above $23,610
This is just IMHO, of course, and therefore just a probability to oberserve and analyise
Tomorrow, Sunday, will give us more clarity on the next moves
for $btc, $egld and the #cryptomarket

f you like this king of analysis follow me @urus1369
And, remember! A RT + ❤️ gets u some high 5s from Satoshi 🙏
And, remember! A RT + ❤️ gets u some high 5s from Satoshi 🙏
https://twitter.com/urus1369/status/1621921865169092611?s=20&t=GL5c5B0AdMj-yaerpT6xGw
Here's what the liquidity heatmap for $btc looks like
On the 1H timeframe:
On the 1H timeframe:

Zoomed in:
2 times has that sell wall at $25,000 been teased...
and removed from the charts
there are some sell orders above at $23,600
though more serious sells remain at $24,500
and I bet that $25k will 'magically' reappear if price goes higher 🥷🔥
also...👇
2 times has that sell wall at $25,000 been teased...
and removed from the charts
there are some sell orders above at $23,600
though more serious sells remain at $24,500
and I bet that $25k will 'magically' reappear if price goes higher 🥷🔥
also...👇

• • •
Missing some Tweet in this thread? You can try to
force a refresh