
Decoding your Favourite indicators ~🧵
1/ MACD
The Moving Average Convergence Divergence (MACD) is a popular indicator among retail traders. It can be found on the charts of many traders who rely on technical analysis for their trading decisions.
However, there is one issue:
1/ MACD
The Moving Average Convergence Divergence (MACD) is a popular indicator among retail traders. It can be found on the charts of many traders who rely on technical analysis for their trading decisions.
However, there is one issue:

Even though this indicator could be really useful when it comes to making trading decisions, most people don't bother to get to know how it works and end up basing their decisions on bad info.
That could really mess up their trading.
That could really mess up their trading.
If you're a trader, it's super important that you get to know the logic and details behind the indicator before trying to use it.
That way, you can make better decisions and up your chances of success.
That way, you can make better decisions and up your chances of success.

In this thread, we will discuss the MACD indicator in detail, in this series what we call #DYFI or decoding your favorite indicators.
So let’s dive right in!
So let’s dive right in!
The MACD indicator was created by Gerald Appel, an American technical analyst, in the late 1970s.

It is a trend following and momentum indicator that measures the relationship between two moving averages. A short-term moving average and a longer-term moving average.
This indicator consists of three components:
1. The MACD line
2. The Signal Line
3. The Histogram
This indicator consists of three components:
1. The MACD line
2. The Signal Line
3. The Histogram

We will discuss each of these in detail, and how you can incorporate it in such a way that it compliments your trading system.👇
⚡️The MACD line
It is the difference between the 12-period EMA (Exponential moving average) and the 26-period EMA.
The 12-period EMA is more responsive to changes in the market compared to the 26-period EMA.
It is the difference between the 12-period EMA (Exponential moving average) and the 26-period EMA.
The 12-period EMA is more responsive to changes in the market compared to the 26-period EMA.

In the event of a strong bullish or bearish move in the market, the 12-period EMA will react quicker to the changes.
This difference in behavior is more pronounced as the trend becomes more intense, leading to greater divergence between the two MAs.
This difference in behavior is more pronounced as the trend becomes more intense, leading to greater divergence between the two MAs.
👉Let's say the 12-period EMA is trading at 200 and the 26-period EMA is trading at 195. In this case, the MACD line will show a value of +5.
👉Now, if the market experiences a strong trending move on the upside, the 12 EMA is now trading at 210, while the 26 EMA is trading at 200. This will cause the MACD line to show a value of +10.
This indicates that the higher the value of the MACD line, the stronger the momentum. If the value is negative, it means that the 12 EMA is trading below 26 EMA, and as the value goes further into the negative territory, it implies that the market is under a strong grip of bears.

⚡️The signal line
It is the 9-period EMA of the MACD.
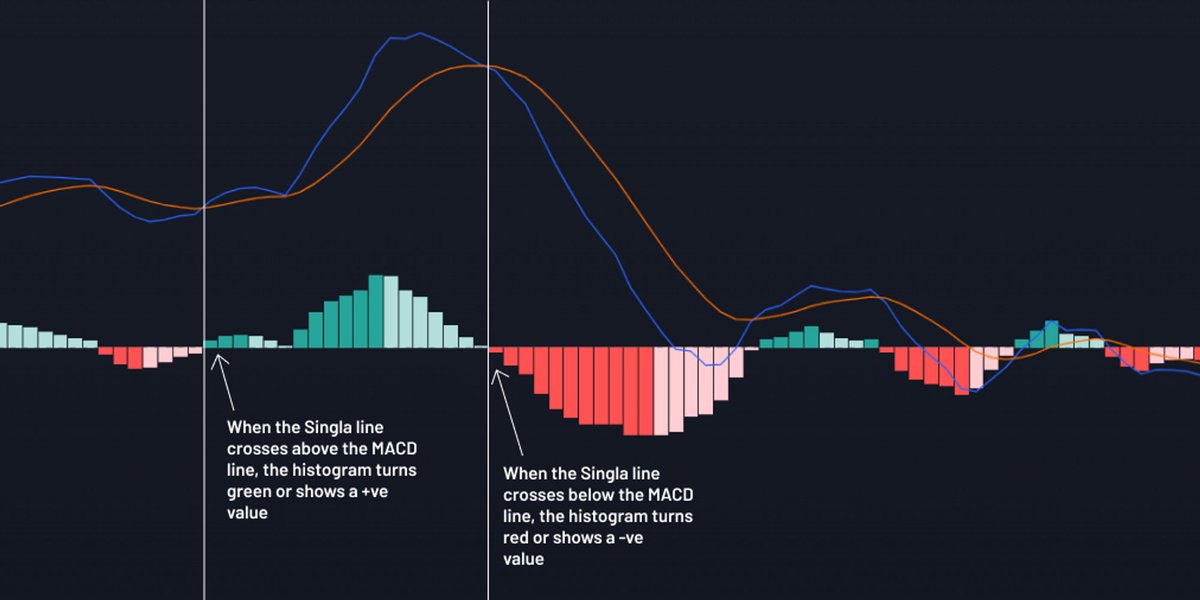
It is used to smoothen the MACD line and is considered a fast signal, when the signal line crosses above the MACD line it is considered to be an indication that the momentum is fading.
It is the 9-period EMA of the MACD.
It is used to smoothen the MACD line and is considered a fast signal, when the signal line crosses above the MACD line it is considered to be an indication that the momentum is fading.
And when the Signal line crosses below the MACD, it means that the bulls are going to take some rest, and the stock might try to pull back toward the downside.

⚡️The histogram
It is simply the difference between the MACD line and the signal line.
It’s just another way of looking at the relationship between the MACD line and the signal line
It is simply the difference between the MACD line and the signal line.
It’s just another way of looking at the relationship between the MACD line and the signal line
Enough of the theory — Now let’s understand how can you use this indicator in live markets.
⚡️It could help you identify the momentum zones
If you are a trend follower, a dip buyer, or you trade similar strategies which need momentum on their side, then you should always be trading the front side of the move
If you are a trend follower, a dip buyer, or you trade similar strategies which need momentum on their side, then you should always be trading the front side of the move
— when the momentum is increasing, the volumes are rushing in, and there is some solid action in the market.

As compared to trading the back side of the move, when the momentum is fading and the markets are trying to revert to their means, you should always avoid trading the back side of the move, if your strategy needs more momentum.
Even as a breakout trader, you would see breakouts sustaining more when they occur during the front side of the move, rather than the backside.
So, a simple way to use MACD is to trade only when the signal line is above the MACD line, in case of a bullish trade, and Vice versa, in a bearish scenario.
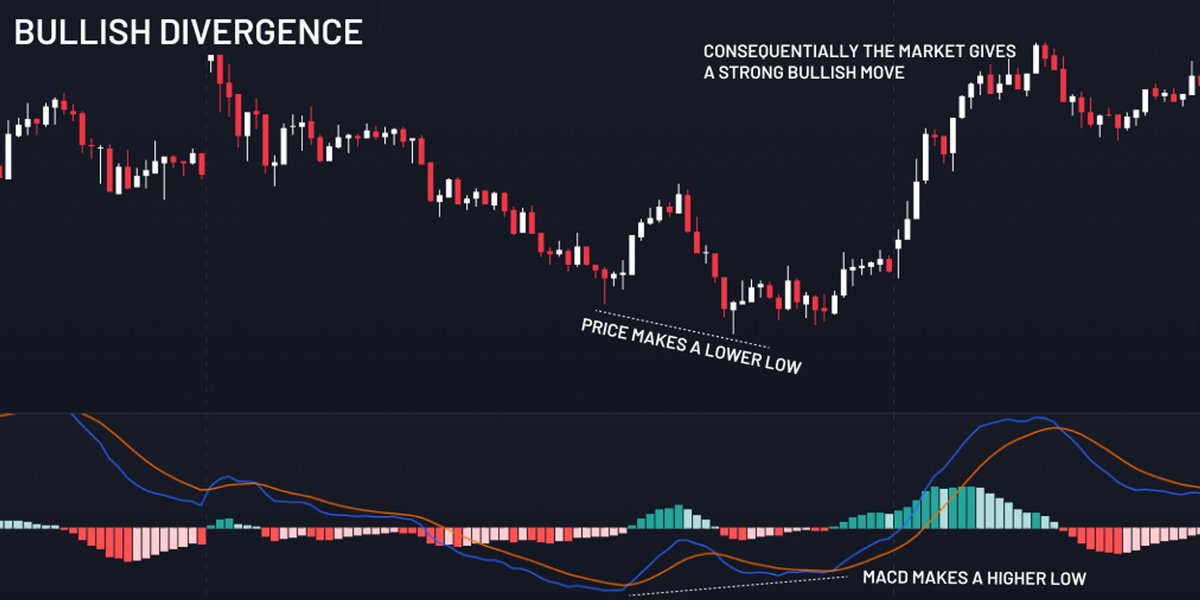
⚡️MACD Divergence
When the MACD is making higher lows and the security is making lower lows, this is called a bullish divergence.
This means the trend of the security is slowing down and may reverse.
When the MACD is making higher lows and the security is making lower lows, this is called a bullish divergence.
This means the trend of the security is slowing down and may reverse.

Example of Bullish divergence:
On the other hand, when the MACD is making lower highs and the security is making higher highs, this is called a bearish divergence.
This means the trend of the security is slowing down and may reverse.
This means the trend of the security is slowing down and may reverse.

Example of Bearish Divergence:

Before using indicators in your trading, keep the following in mind:
▶️Technical indicators are not perfect and can provide false signals, especially in volatile market conditions.
▶️Technical indicators are not perfect and can provide false signals, especially in volatile market conditions.
It's important to understand the limitations of each indicator and to use them in combination with other analysis techniques to confirm signals.
▶️It's always a good idea to look for confluence, or the agreement of multiple indicators and analysis techniques, before making a trade decision.
This can help increase the likelihood of a successful trade and reduce the risk of false signals.
This can help increase the likelihood of a successful trade and reduce the risk of false signals.
▶️Technical indicators are best used in the context of a larger trend. Before using an indicator, it's important to identify the overall trend of the security and to use the indicator to support and confirm this trend.
For confluence trading, you might love to read this
https://twitter.com/finkarmaIN/status/1619946571709177857
The front side of the move vs The back side of the move 👇

• • •
Missing some Tweet in this thread? You can try to
force a refresh


