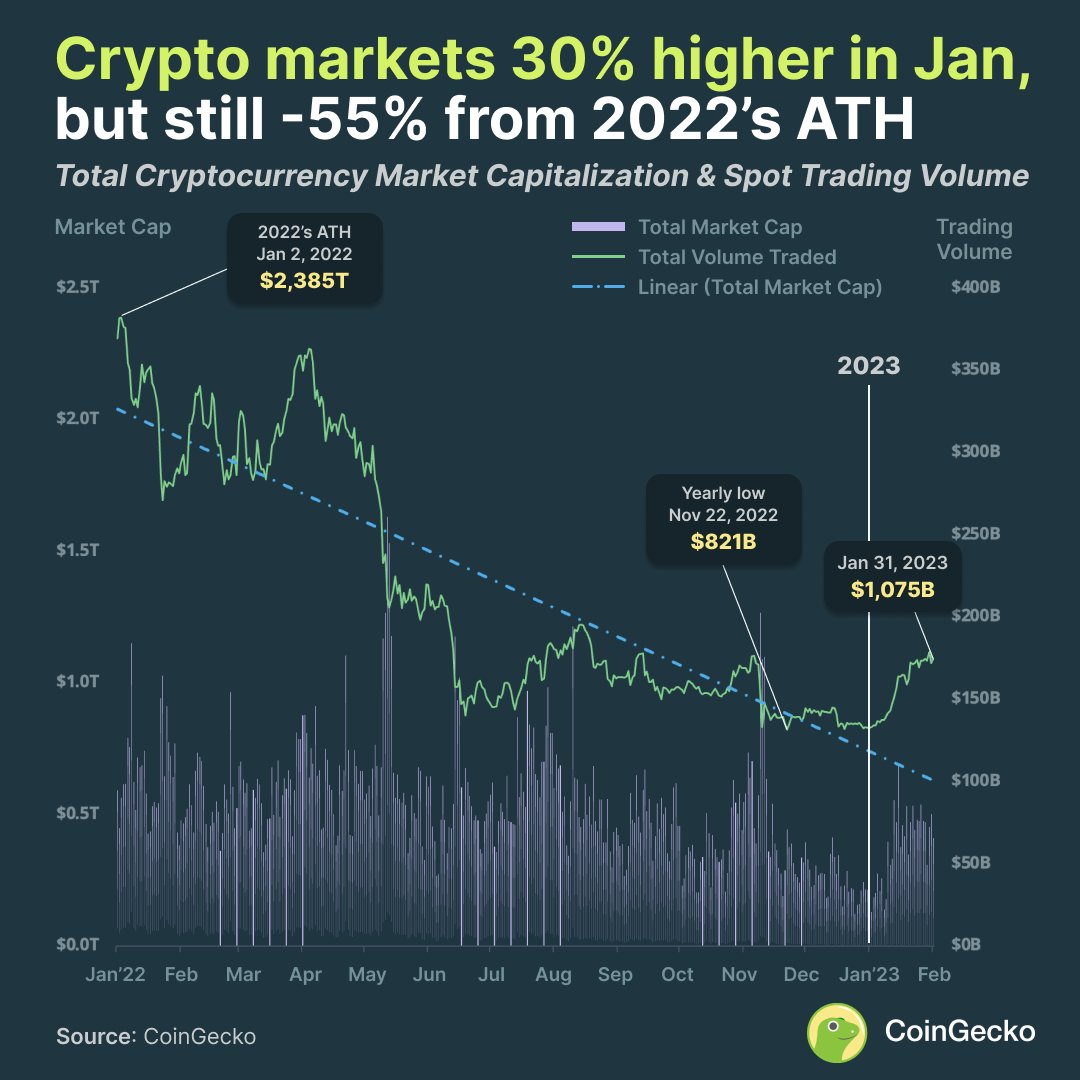
1/ #Crypto hacks and exploits have caused $2.8B in losses last year, the highest since 2013.
47% of these funds were stolen using a diverse range of hacking and exploitation methods.
Read the full study: gcko.io/i6o56zo
47% of these funds were stolen using a diverse range of hacking and exploitation methods.
Read the full study: gcko.io/i6o56zo
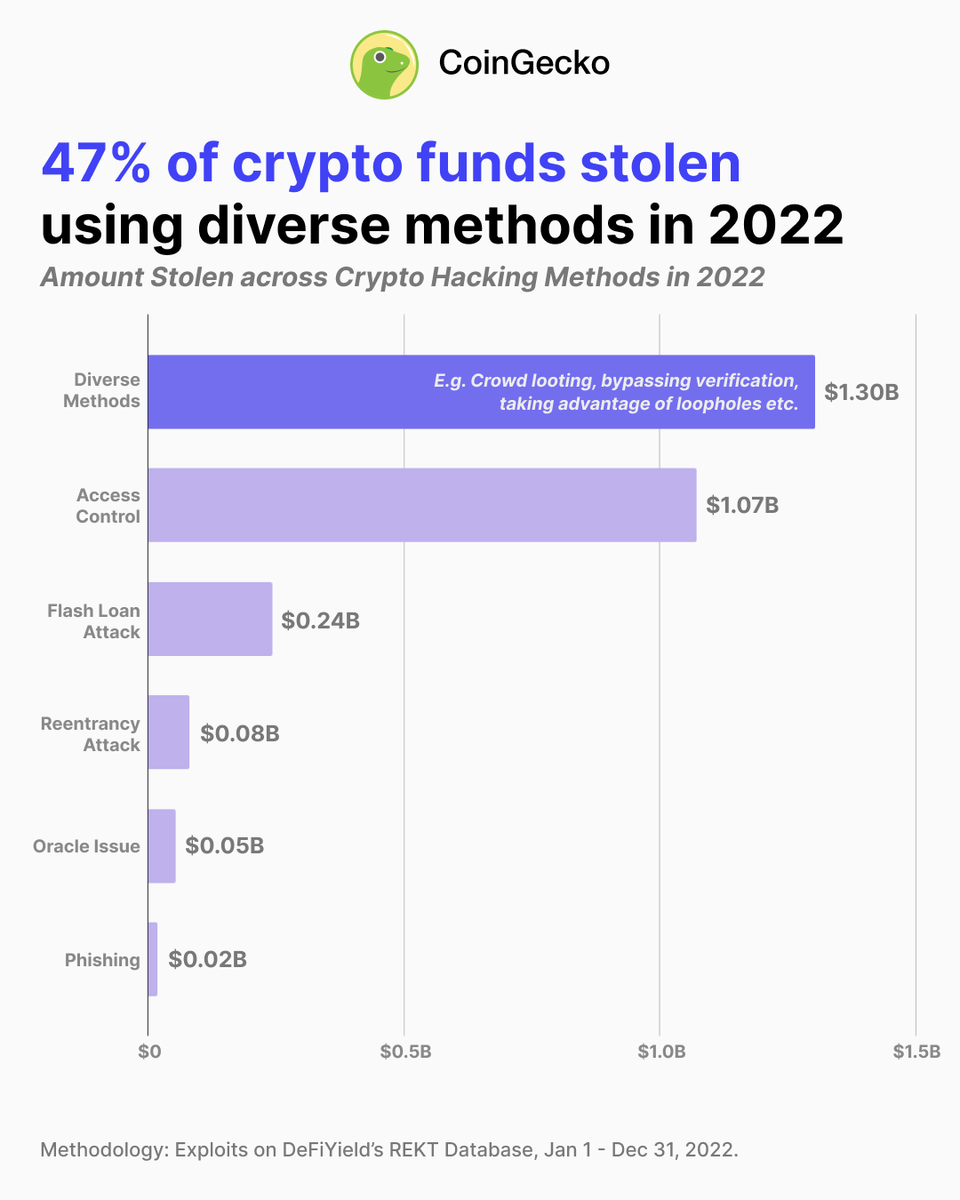
2/ The range of diverse methods include bypassing verification processes, market manipulation, ‘crowd looting’, taking advantage of smart contract errors or loopholes, and more.
3/ Unconventional methods were used for some of the biggest heists of 2022, including the Wormhole Hack, Nomad Bridge Exploit, and Mango Markets Hack.
• Wormhole Hack saw hackers bypassing verifications with a forged signature to mint $326M worth of crypto.
• Wormhole Hack saw hackers bypassing verifications with a forged signature to mint $326M worth of crypto.
• Nomad's smart contract allowed for 'crowd looting', resulting in $190M in losses.
• Mango Markets was hacked using market manipulation, with the hacker managing to steal $116M.
• Mango Markets was hacked using market manipulation, with the hacker managing to steal $116M.
4/ However, the biggest heist of 2022 was caused by an access control hack.
The Sky Mavis’ Ronin bridge hack saw attackers gain access to five private keys, stealing $625M making up 58.3% of access control hacks in 2022.
The Sky Mavis’ Ronin bridge hack saw attackers gain access to five private keys, stealing $625M making up 58.3% of access control hacks in 2022.
5/ As bridges become more important in the #crypto ecosystem, malicious actors have targeted them to steal funds.
In fact, 65% of funds stolen last year were from the top 5 bridge hacks.
In fact, 65% of funds stolen last year were from the top 5 bridge hacks.
6/ Interestingly, flash loan attacks, reentrancy hacks, oracle issue hacks, and phishing methods were used the least by #crypto hackers, accounting for only a small percentage of the year's losses.
7/ Methodology: The study examined how much funds were lost as a result of each hack or exploit method in 2022, based on data from @defiyield_app’s REKT Database.
defiyield.app/rekt-database
defiyield.app/rekt-database
8/ Check out the full study here: gcko.io/i6o56zo
What breakdowns would you like to see next? Comment and let us know below ⬇️
What breakdowns would you like to see next? Comment and let us know below ⬇️
• • •
Missing some Tweet in this thread? You can try to
force a refresh