Kaushik Profile picture
Mar 8 โ€ข 4 tweets โ€ข 5 min read
#HAL- From 64 to 130 ๐Ÿš€

#Cummins- From 36 to 66 ๐Ÿš€

#Ipcalab- 21 to 25 ๐Ÿ”ฅ2nd target hit till now

#Bhel- 1.95 to 2.2 ๐Ÿ”ฅ

#OberoiReality- 17 to 24.5 ๐ŸŽฏ1st target hit till now

Another great day for us.

All trades were shared in our FREE TELEGRAM CHANNEL: t.me/thetradingcircโ€ฆ ImageImageImageImage
#NationalAlum- SL hit as open gap down. ImageImageImage
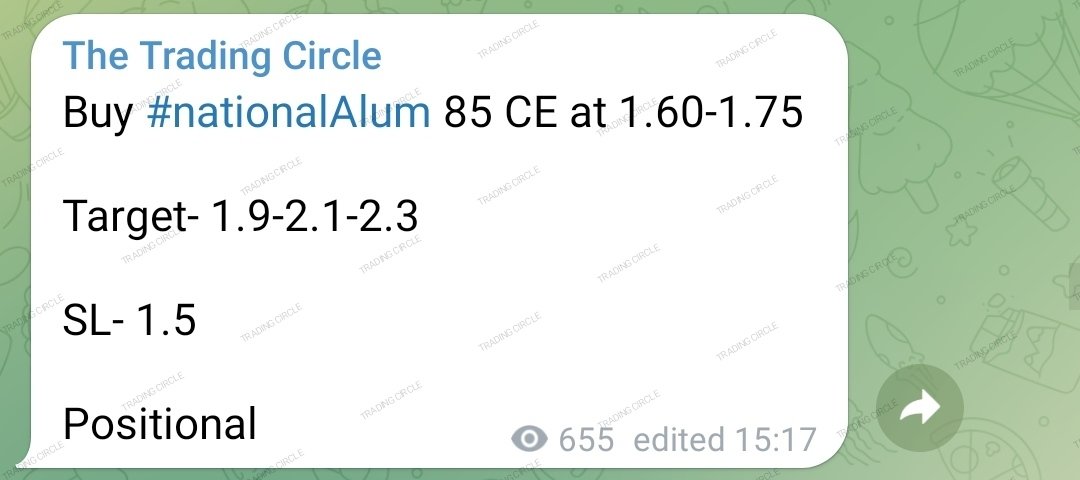
All screenshots are attached ImageImageImageImage
ImageImageImage

โ€ข โ€ข โ€ข

Missing some Tweet in this thread? You can try to force a refresh
ใ€€

Keep Current with Kaushik

Kaushik Profile picture

Stay in touch and get notified when new unrolls are available from this author!

Read all threads

This Thread may be Removed Anytime!

PDF

Twitter may remove this content at anytime! Save it as PDF for later use!

Try unrolling a thread yourself!

how to unroll video
  1. Follow @ThreadReaderApp to mention us!

  2. From a Twitter thread mention us with a keyword "unroll"
@threadreaderapp unroll

Practice here first or read more on our help page!

More from @me__kaushik

Mar 11
Inside bar trading strategy is a popular trading strategy among traders.

๐—” ๐—ง๐—ต๐—ฟ๐—ฒ๐—ฎ๐—ฑ ๐Ÿงต ๐—ผ๐—ป ๐—œ๐—ป๐˜€๐—ถ๐—ฑ๐—ฒ ๐—•๐—ฎ๐—ฟ

RETWEET โ™ป if you find it useful.

@Stocktwit_IN @KommawarSwapnil @kuttrapali26 @caniravkaria @Jagadeesh0203

#StockMarket #StockMarketindia #trading #stocks Image
๐Ÿ“What is Inside bar?

An Inside bar means the high and low of the baby candle is completely within the high and low of the Mother candle.

The image below is an example of an inside bar where we can see the baby candle is completely inside the Mother candle. ImageImage
๐Ÿ“When to trade Inside Bar?

Inside bars can be traded in trending markets in the direction of the trend.

Inside bars can also be traded near demand and supply zone, when traded this way they are often referred to as inside bar reversals.
Read 15 tweets
Feb 26
The relative strength index is one of the indicators that 99% of trader uses.

A Thread ๐Ÿงตon RSI

RETWEET โ™ป if you find it useful

Course Worth: โ‚น25K-โ‚น30K
@kuttrapali26 @KommawarSwapnil @Jagadeesh0203 @caniravkaria @sunilgurjar01 @itsprekshaBaid

#StockMarket #trading #stocks
๐Ÿ“What is RSI?

Relative Strength Index(RSI), developed by J. Welles Wilder, is a momentum indicator that measures the speed and change of price movements.

Divergences and swing failures can be used to generate signals. The RSI can also be used to determine the overall trend.
The RSI oscillates between 0 and 100. Traditionally the RSI is considered overbought when above 70 and oversold when below 30.

But this is not the case in reality. When RSI is above 70, it shows strong momentum, especially in higher timeframes.
Read 25 tweets
Feb 18
Moving average is one the simplest indicator which many traders and investor use for technical analysis.

๐—” ๐—ง๐—ต๐—ฟ๐—ฒ๐—ฎ๐—ฑ ๐—ผ๐—ป ๐— ๐—ผ๐˜ƒ๐—ถ๐—ป๐—ด ๐—”๐˜ƒ๐—ฒ๐—ฟ๐—ฎ๐—ด๐—ฒ ๐Ÿงต

Retweet โ™ป for maximum reach.

@kuttrapali26 @caniravkaria @AdityaTodmal @Jagadeesh0203 @niki_poojary @KommawarSwapnil
๐Ÿ“What is Moving Average?

A moving average is a technical indicator that investors and traders use to determine the trend direction of a stock or to determine its support and resistance levels.

It is a trend-following or lagging indicator because it is based on past prices.
๐Ÿ“Types of Moving Average

๐Ÿ‘‰ Simple Moving Average (SMA): SMA is a technical indicator calculated by adding the most recent data points in a set and dividing the total by the number of time periods.
Read 19 tweets
Feb 5
VWAP is one of the most important indicator which is used by many traders for day trading.

๐—” ๐—ง๐—ต๐—ฟ๐—ฒ๐—ฎ๐—ฑ ๐—ผ๐—ป ๐—ฉ๐—ช๐—”๐—ฃ ๐Ÿงต

Retweet โ™ป for maximum reach.

@kuttrapali26 @caniravkaria @sunilgurjar01 @Anshi_________ @KommawarSwapnil @Jagadeesh0203 Image
๐Ÿ“ What is Vwap?

The Volume Weighted Average Price (VWAP) is a tool which is used for day trading only. It shows the average price of a stock weighted by the total trading volume. The VWAP is used to calculate the average price of a stock over a period of time.
Generally, whenever the price trades below vwap it should not be bought and if trades above vwap it should not be
sold, but it is not always the case.

Vwap is based on historical data and can be used to determine the right intraday trend.
Read 17 tweets
Jan 15
Tired of scanning 500+ stocks manually??

We have a one stop solution for you.

Here are 11 important candlestick scanners available for FREE.

These scanners will help you filter stocks out of 5000+ stocks and thus saves a lot of time.

Thread on candlestick scanners ๐Ÿงต
1) Bullish Engulfing

A bullish engulfing pattern is a pattern that forms when a small red candlestick is followed the next day by a large green candlestick, the body of which completely overlaps or engulfs the body of the previous dayโ€™s candlestick.

chartink.com/screener/bulliโ€ฆ
2) Bearish Engulfing

A bearish engulfing pattern is a pattern that forms when a small green candlestick is followed the next day by a large red candlestick, the body of which completely overlaps or engulfs the body of the previous dayโ€™s candlestick.

chartink.com/screener/beariโ€ฆ
Read 13 tweets

Did Thread Reader help you today?

Support us! We are indie developers!


This site is made by just two indie developers on a laptop doing marketing, support and development! Read more about the story.

Become a Premium Member ($3/month or $30/year) and get exclusive features!

Become Premium

Don't want to be a Premium member but still want to support us?

Make a small donation by buying us coffee ($5) or help with server cost ($10)

Donate via Paypal

Or Donate anonymously using crypto!

Ethereum

0xfe58350B80634f60Fa6Dc149a72b4DFbc17D341E copy

Bitcoin

3ATGMxNzCUFzxpMCHL5sWSt4DVtS8UqXpi copy

Thank you for your support!

Follow Us on Twitter!

:(