Kaushik Profile picture
MBA || FINANCE || TRADER || INVESTOR || NOT SEBI REGISTERED ||
Dec 24, 2023 11 tweets 3 min read
A MEGA THREAD COMBINING ALL THE THREADS 🧵

Like ❤ Retweet ♻ for maximum reach.

#StockMarket #trading #investing 📍Thread on RSI

Dec 17, 2023 12 tweets 3 min read
Tired of scanning 2000+ stocks manually?

We have a one stop solution for you

Here are 10 BEST scanners available for FREE

Don't miss the 8th one

These scanners will help you saves a lot of time

A Thread 🧵on scanners

LIKE ❤ & RETWEET ♻ FOR MAXIMUM REACH.

@KommawarSwapnil Image 📍1. Daily Range Contraction Scanner

chartink.com/screener/4-day…
Sep 30, 2023 25 tweets 9 min read
The relative strength index is one of the indicators that 99% of trader uses.

A Thread 🧵on RSI.

RETWEET ♻ if you find it useful.

Course Worth: ₹25K-₹30K.

@kuttrapali26 @KommawarSwapnil @sunilgurjar01 @caniravkaria

#StockMarket #trading #forex #Nifty #banknifty Image 📍What is RSI?

Relative Strength Index(RSI), developed by J. Welles Wilder, is a momentum indicator that measures the speed and change of price movements.

Divergences and swing failures can be used to generate signals. The RSI can also be used to determine the overall trend.
Jul 22, 2023 10 tweets 3 min read
Tired of scanning 500+ stocks manually??

Here are 8 Breakout scanners available for FREE.

These scanners will help you filter stocks out of 5000+ stocks and thus saves a lot of time.

A Thread 🧵 on scanners

Retweet ♻ for maximum reach.

@kuttrapali26 @KommawarSwapnil 📍52 Week high breakout scanner

chartink.com/screener/52-we…
May 27, 2023 22 tweets 9 min read
The CPR is a popular intraday indicator that traders use daily.

A thread 🧵 on CPR trading strategy.

TG: t.me/thetradingcirc…

Retweet ♻ if you find it useful

Course Worth: 20-25K

@Stocktwit_IN @kuttrapali26 @KommawarSwapnil @caniravkaria

#StockMarket #nifty #forex Image 📍What is CPR?

The Central Pivot Range is widely known as CPR. Traders can use it for intraday, swing, or positional trading

The CPR levels help traders to foresee the movements in stock prices & to predict the trend and also provide us with major support and resistance levels
May 21, 2023 17 tweets 5 min read
Tired of scanning 500+ stocks manually??

We have a one stop solution for you.

Here are 10 important scanners available for FREE.

𝗔 𝗧𝗵𝗿𝗲𝗮𝗱 🧵 𝗼𝗻 𝘀𝗰𝗮𝗻𝗻𝗲𝗿𝘀

Retweet ♻ if you find it useful.

@kuttrapali26 @KommawarSwapnil @caniravkaria

#StockMarket #Nifty 1) Position for short term chartink.com/screener/posit…
Apr 1, 2023 20 tweets 8 min read
Bollinger Band is a popular indicator among traders and investors.

𝗔 𝘁𝗵𝗿𝗲𝗮𝗱 🧵 𝗼𝗻 𝗕𝗼𝗹𝗹𝗶𝗻𝗴𝗲𝗿 𝗕𝗮𝗻𝗱

RETWEET ♻ if you find it useful

Course Worth: ₹25K-₹30K

@Stocktwit_IN @kuttrapali26 @KommawarSwapnil @caniravkaria @Jagadeesh0203

#StockMarket #trading 📍What is Bollinger Band?

Bollinger Bands is an indicator that was developed by John Bollinger to generate oversold or overbought signals.

Three lines compose Bollinger Bands: A simple moving average, (middle band), and an upper and lower band.
Mar 11, 2023 15 tweets 8 min read
Inside bar trading strategy is a popular trading strategy among traders.

𝗔 𝗧𝗵𝗿𝗲𝗮𝗱 🧵 𝗼𝗻 𝗜𝗻𝘀𝗶𝗱𝗲 𝗕𝗮𝗿

RETWEET ♻ if you find it useful.

@Stocktwit_IN @KommawarSwapnil @kuttrapali26 @caniravkaria @Jagadeesh0203

#StockMarket #StockMarketindia #trading #stocks 📍What is Inside bar?

An Inside bar means the high and low of the baby candle is completely within the high and low of the Mother candle.

The image below is an example of an inside bar where we can see the baby candle is completely inside the Mother candle.
Mar 8, 2023 4 tweets 5 min read
#HAL- From 64 to 130 🚀

#Cummins- From 36 to 66 🚀

#Ipcalab- 21 to 25 🔥2nd target hit till now

#Bhel- 1.95 to 2.2 🔥

#OberoiReality- 17 to 24.5 🎯1st target hit till now

Another great day for us.

All trades were shared in our FREE TELEGRAM CHANNEL: t.me/thetradingcirc… ImageImageImageImage #
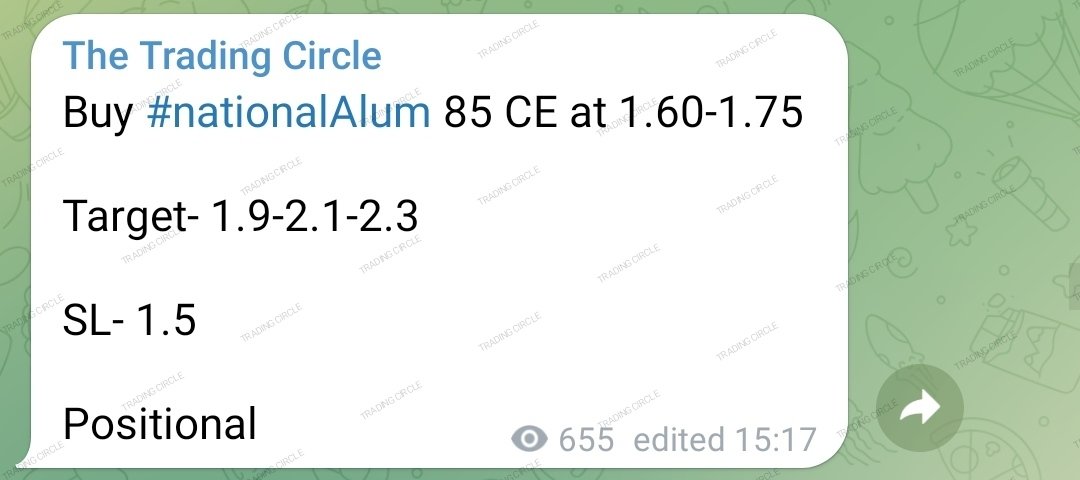
NationalAlum- SL hit as open gap down. ImageImageImage
Feb 26, 2023 25 tweets 11 min read
The relative strength index is one of the indicators that 99% of trader uses.

A Thread 🧵on RSI

RETWEET ♻ if you find it useful

Course Worth: ₹25K-₹30K
@kuttrapali26 @KommawarSwapnil @Jagadeesh0203 @caniravkaria @sunilgurjar01 @itsprekshaBaid

#StockMarket #trading #stocks 📍What is RSI?

Relative Strength Index(RSI), developed by J. Welles Wilder, is a momentum indicator that measures the speed and change of price movements.

Divergences and swing failures can be used to generate signals. The RSI can also be used to determine the overall trend.
Feb 18, 2023 19 tweets 8 min read
Moving average is one the simplest indicator which many traders and investor use for technical analysis.

𝗔 𝗧𝗵𝗿𝗲𝗮𝗱 𝗼𝗻 𝗠𝗼𝘃𝗶𝗻𝗴 𝗔𝘃𝗲𝗿𝗮𝗴𝗲 🧵

Retweet ♻ for maximum reach.

@kuttrapali26 @caniravkaria @AdityaTodmal @Jagadeesh0203 @niki_poojary @KommawarSwapnil 📍What is Moving Average?

A moving average is a technical indicator that investors and traders use to determine the trend direction of a stock or to determine its support and resistance levels.

It is a trend-following or lagging indicator because it is based on past prices.
Feb 5, 2023 17 tweets 8 min read
VWAP is one of the most important indicator which is used by many traders for day trading.

𝗔 𝗧𝗵𝗿𝗲𝗮𝗱 𝗼𝗻 𝗩𝗪𝗔𝗣 🧵

Retweet ♻ for maximum reach.

@kuttrapali26 @caniravkaria @sunilgurjar01 @Anshi_________ @KommawarSwapnil @Jagadeesh0203 Image 📍 What is Vwap?

The Volume Weighted Average Price (VWAP) is a tool which is used for day trading only. It shows the average price of a stock weighted by the total trading volume. The VWAP is used to calculate the average price of a stock over a period of time.
Jan 15, 2023 13 tweets 5 min read
Tired of scanning 500+ stocks manually??

We have a one stop solution for you.

Here are 11 important candlestick scanners available for FREE.

These scanners will help you filter stocks out of 5000+ stocks and thus saves a lot of time.

Thread on candlestick scanners 🧵 1) Bullish Engulfing

A bullish engulfing pattern is a pattern that forms when a small red candlestick is followed the next day by a large green candlestick, the body of which completely overlaps or engulfs the body of the previous day’s candlestick.

chartink.com/screener/bulli…