Stock Chart Patterns ↗️↔️↘️

If you #LIKE then also #Retweet please

Stock chart patterns often signal transitions between rising and falling trends.

These patterns can be as simple as trendlines and as complex as double head-and-shoulders formations. Image
Since price patterns are identified using a series of lines or curves, it is helpful to understand trendlines and know how to draw them. Trendlines help technical analysts spot support and resistance areas on a price chart. Image
A chart pattern is a shape within a price chart that helps to suggest what prices might do next, based on what they have done in the past. Image
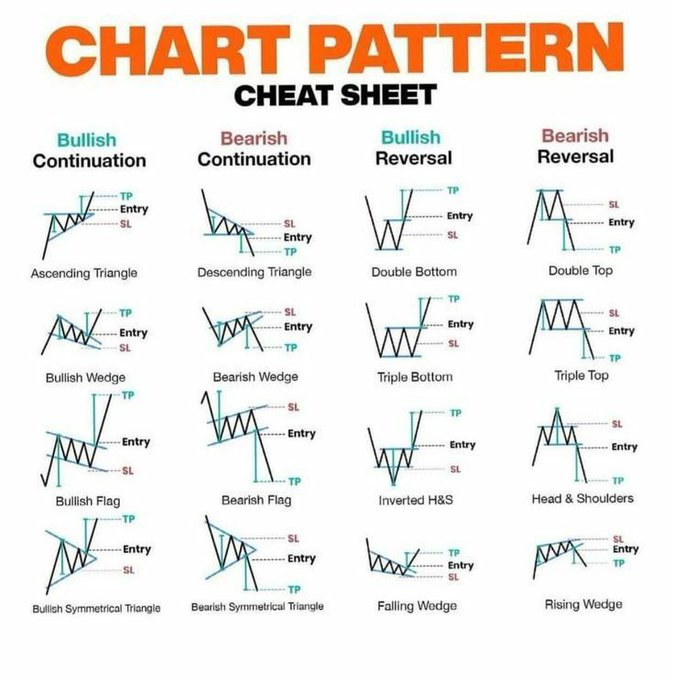
Chart patterns are the basis of technical analysis and require a trader to know exactly what they are looking at, as well as what they are looking for. 📊 👀 Image
A continuation pattern can be considered a pause during a prevailing trend. This is when the bulls catch their breath during an uptrend or when the bears relax for a moment during a downtrend. Image
Reversal patterns are those chart formations that signal that the ongoing trend is about to change course. If a reversal chart pattern forms during an uptrend, it hints that the trend will reverse and that the price will head down soon. Image
Learn more about Best chart patterns 👇
by @valuelevels


Head and shoulders
Double top
Double bottom
Rounding bottom
Cup and handle
Wedges
Pennant or flags
Ascending triangle
Descending triangle
Symmetrical triangle

• • •

Missing some Tweet in this thread? You can try to force a refresh
 

Keep Current with Stock Twit📈

Stock Twit📈 Profile picture

Stay in touch and get notified when new unrolls are available from this author!

Read all threads

This Thread may be Removed Anytime!

PDF

Twitter may remove this content at anytime! Save it as PDF for later use!

Try unrolling a thread yourself!

how to unroll video
  1. Follow @ThreadReaderApp to mention us!

  2. From a Twitter thread mention us with a keyword "unroll"
@threadreaderapp unroll

Practice here first or read more on our help page!

More from @Stocktwit_IN

Mar 12
Inside bar trading strategy is a popular trading strategy among traders.

𝗔 𝗧𝗵𝗿𝗲𝗮𝗱 🧵 𝗼𝗻 𝗜𝗻𝘀𝗶𝗱𝗲 𝗕𝗮𝗿 by @me__kaushik

RETWEET ♻ if you find it useful.

#StockMarket #StockMarketindia #trading #stocks Image
📍What is Inside bar?

An Inside bar means the high and low of the baby candle is completely within the high and low of the Mother candle.

The image below is an example of an inside bar where we can see the baby candle is completely inside the Mother candle. ImageImage
📍When to trade Inside Bar?

Inside bars can be traded in trending markets in the direction of the trend.

Inside bars can also be traded near demand and supply zone, when traded this way they are often referred to as inside bar reversals.
Read 14 tweets
Mar 11
OPENING RANGE BREAKOUT STRATEGY EXPLAINED

Opening range breakout trading is an interesting concept. Several traders have asked us how to take advantage of the opening range breakout strategy and if it is a good option. So, we decided it requires a separate discussion. Image
What Is Opening Price And Why It Is Important?

To understand the opening range breakout strategy, we must clear our understanding of the opening price of the day.

Often the opening sets the mood for trading for the day – uptrend or downtrend.
Key Understanding

🔖 The beginning hour of the trading day is the most active and dynamic period. The opening hours sets the sentiment of the market

🔖 You can make the most money during the opening hour, but it is also volatile
Read 5 tweets
Feb 24
In Technical Analysis, a candlestick pattern is a movement in prices shown graphically on a candlestick chart that some believe can predict a particular market movement.

thread 🧵 👇 with @valuelevels
& @TradingView_IN

#TechnicalTrades #TradingView Image
History:
Some of the earliest technical trading analysis was used to track prices of rice in the 18th century. Much of the credit for candlestick charting goes to Munehisa Homma (1724–1803), a rice merchant from Sakata, Japan who traded in the Ojima Rice market in Osaka

#stocks
Formation of the candlestick:
Candlesticks are graphical representations of price movements for a given period of time. They are commonly formed by the opening, high, low, and closing prices of a financial instrument.

#priceaction #StocksToTrade
Read 11 tweets
Dec 18, 2022
In Technical Analysis, a candlestick pattern is a movement in prices shown graphically on a candlestick chart that some believe can predict a particular market movement.

thread 🧵 👇 with @valuelevels
& @TradingView_IN

#TechnicalTrades #TradingView
@valuelevels @TradingView_IN History:
Some of the earliest technical trading analysis was used to track prices of rice in the 18th century. Much of the credit for candlestick charting goes to Munehisa Homma (1724–1803), a rice merchant from Sakata, Japan who traded in the Ojima Rice market in Osaka

#stocks
@valuelevels @TradingView_IN Formation of the candlestick:
Candlesticks are graphical representations of price movements for a given period of time. They are commonly formed by the opening, high, low, and closing prices of a financial instrument.

#priceaction #StocksToTrade
Read 11 tweets
Nov 18, 2022
In Technical Analysis, a candlestick pattern is a movement in prices shown graphically on a candlestick chart that some believe can predict a particular market movement.

thread 🧵 👇 with
@valuelevels
&
@TradingView_IN

#TechnicalTrades #TradingView
History:
Some of the earliest technical trading analysis was used to track prices of rice in the 18th century. Much of the credit for candlestick charting goes to Munehisa Homma (1724–1803), a rice merchant from Sakata, Japan who traded in the Ojima Rice market in Osaka
Formation of the candlestick:
Candlesticks are graphical representations of price movements for a given period of time. They are commonly formed by the opening, high, low, and closing prices of a financial instrument.
Read 11 tweets
Oct 5, 2022
Stock Chart Patterns ↗️↔️↘️

Stock chart patterns often signal transitions between rising and falling trends.

These patterns can be as simple as trendlines and as complex as double head-and-shoulders formations. Image
Since price patterns are identified using a series of lines or curves, it is helpful to understand trendlines and know how to draw them. Trendlines help technical analysts spot support and resistance areas on a price chart. Image
A chart pattern is a shape within a price chart that helps to suggest what prices might do next, based on what they have done in the past. Image
Read 8 tweets

Did Thread Reader help you today?

Support us! We are indie developers!


This site is made by just two indie developers on a laptop doing marketing, support and development! Read more about the story.

Become a Premium Member ($3/month or $30/year) and get exclusive features!

Become Premium

Don't want to be a Premium member but still want to support us?

Make a small donation by buying us coffee ($5) or help with server cost ($10)

Donate via Paypal

Or Donate anonymously using crypto!

Ethereum

0xfe58350B80634f60Fa6Dc149a72b4DFbc17D341E copy

Bitcoin

3ATGMxNzCUFzxpMCHL5sWSt4DVtS8UqXpi copy

Thank you for your support!

Follow Us on Twitter!

:(