Selling $BTC now might be a big mistake.
A thread🧵👇
A thread🧵👇
1/ Disclaimer:
Please know that I will combine technical analysis, historical chart patterns, fundamental factors of #Bitcoin scarcity, and seasonal patterns in the next tweets. The future is unpredictable. Profits are not guaranteed. Losses are inevitable.
Ready? Let's roll👇
Please know that I will combine technical analysis, historical chart patterns, fundamental factors of #Bitcoin scarcity, and seasonal patterns in the next tweets. The future is unpredictable. Profits are not guaranteed. Losses are inevitable.
Ready? Let's roll👇
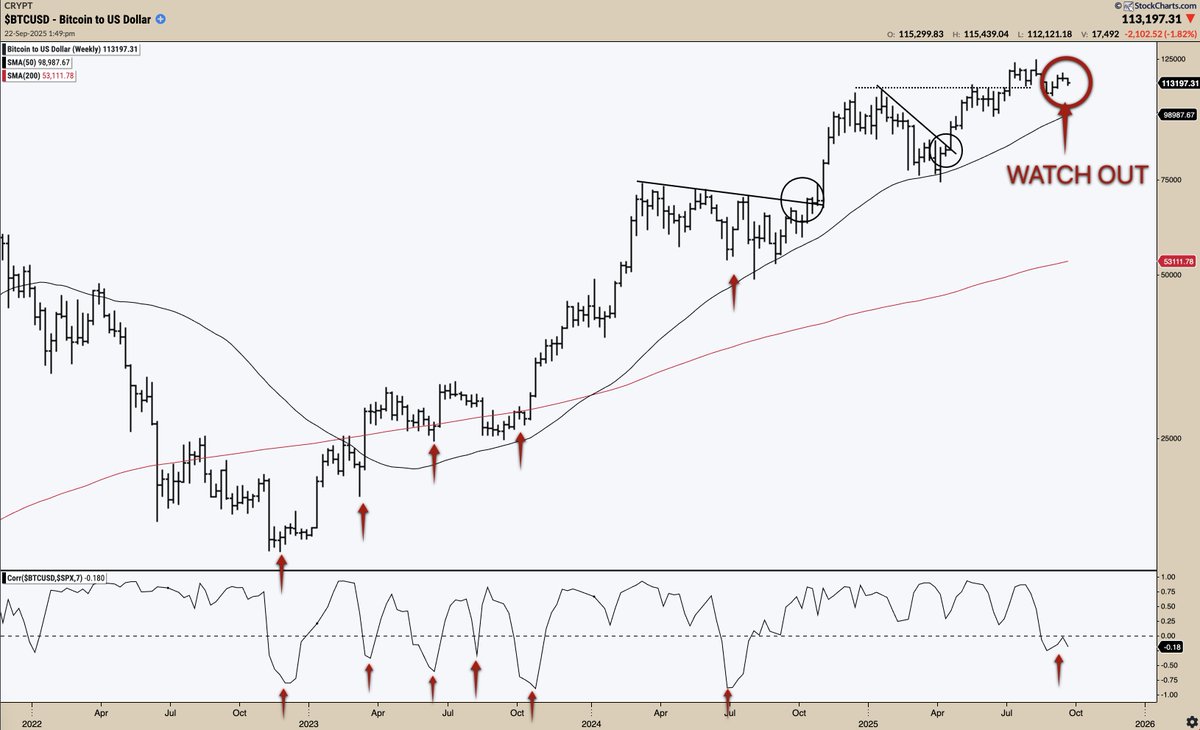
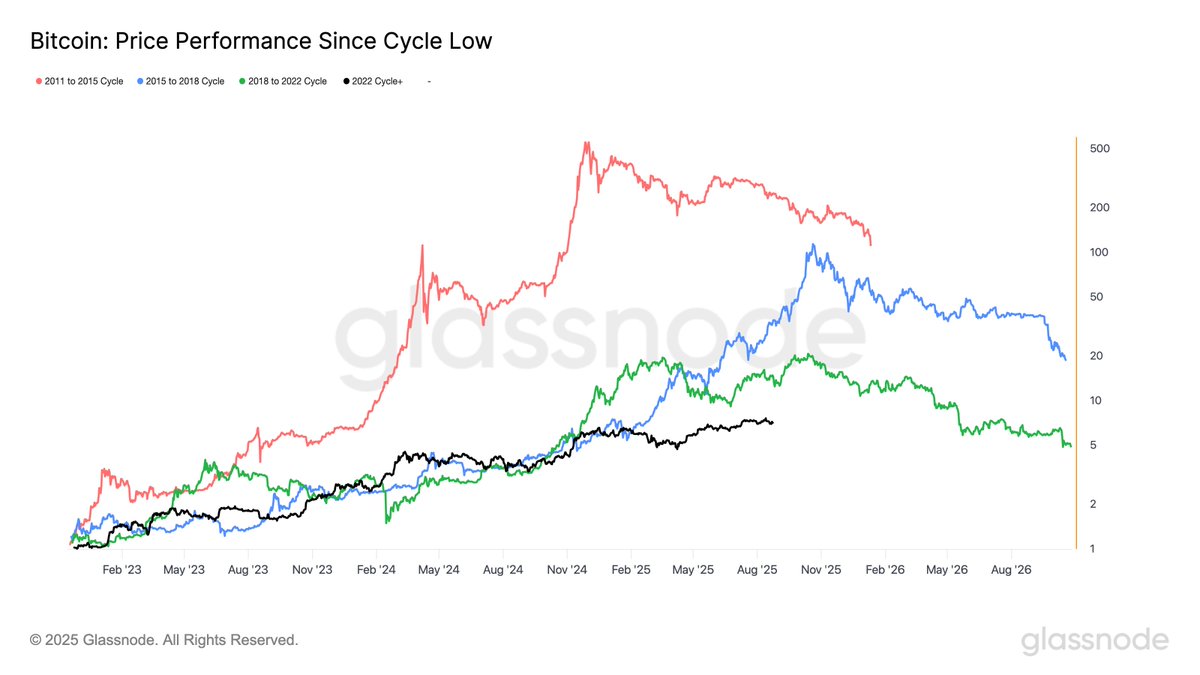
2/ As the #Bitcoin prices retraced ~20% from the peak, the 200-day mean trend moves sideways, regardless of the recent price drop. This confirms that the local breakdown of $21500 does not impact the long-term trend shift. Instead, it is a casual correction following a 65% surge. 
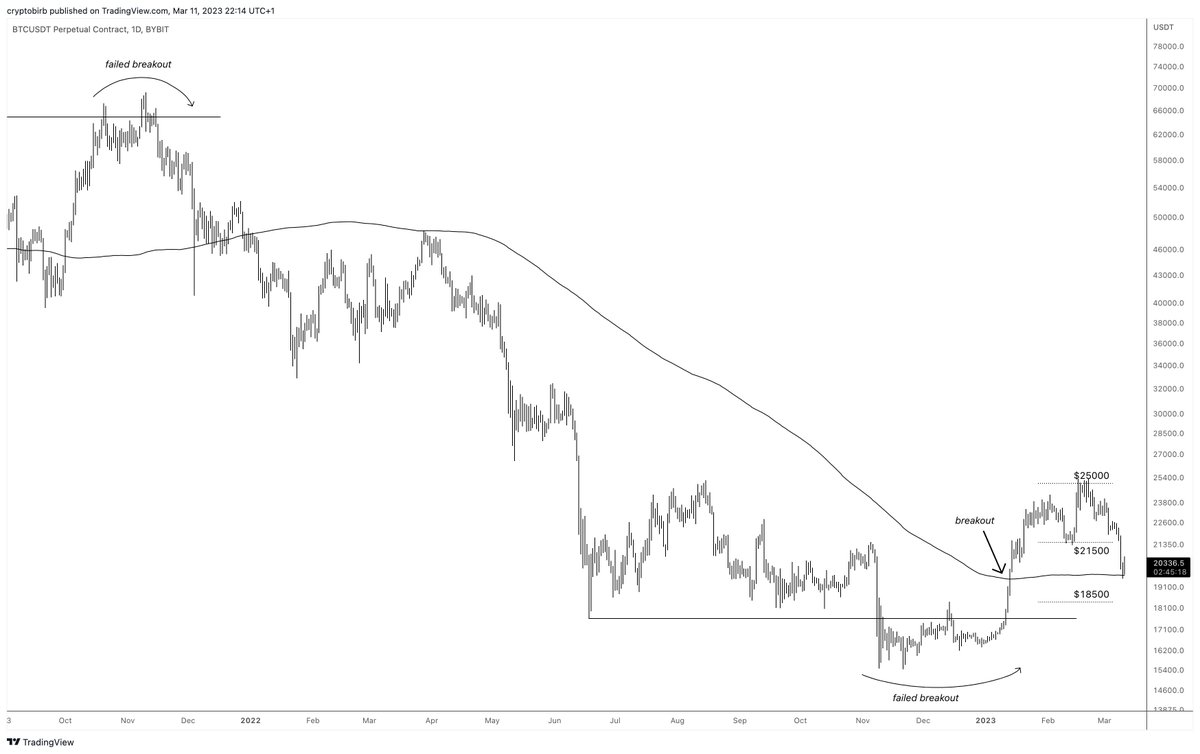
3/ Overall, until proven wrong, $BTC is in a long-term accumulation zone within the $15500-25200 zone, a horizontal movement full of indecisive price action.
Local slides toward $18500 are possible without invalidating the dominant upward tendency.
Local slides toward $18500 are possible without invalidating the dominant upward tendency.

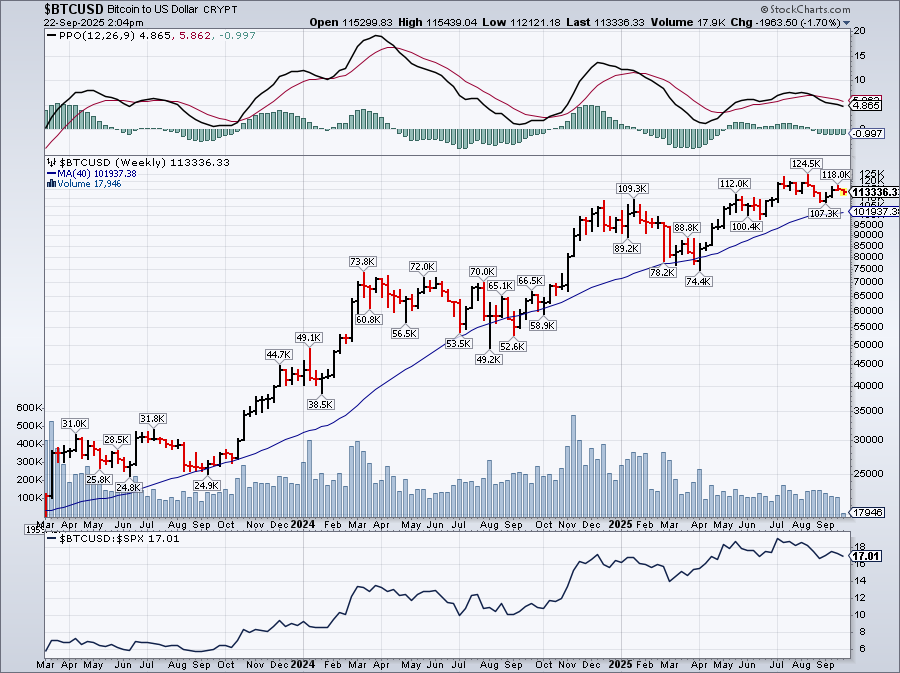
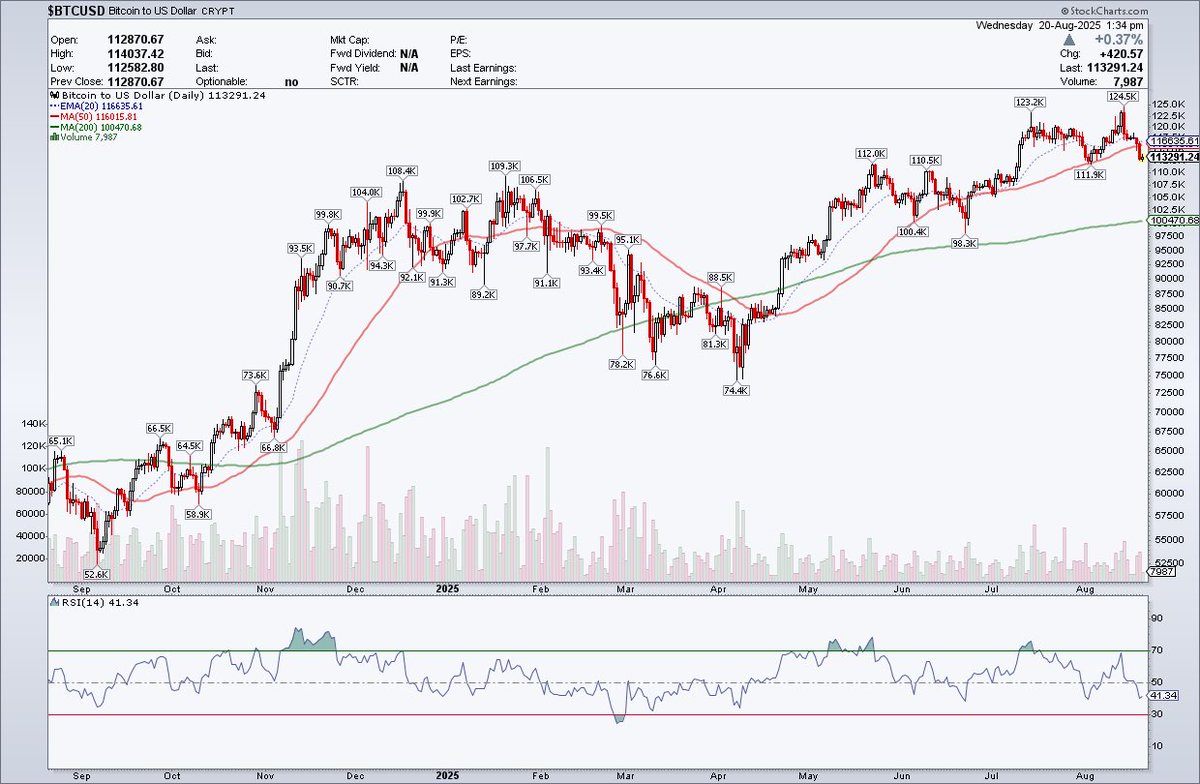
4/ Full transparency: my trend system is cashed, and I hold no particular stake for $BTC to go up now. There's little bias.
The HTF Trailer trend indicator flashed a sell signal at $23700. The bears are in charge until the $21700 resistance is reclaimed.
The HTF Trailer trend indicator flashed a sell signal at $23700. The bears are in charge until the $21700 resistance is reclaimed.
https://twitter.com/crypto_birb/status/1629287030432710657?s=20

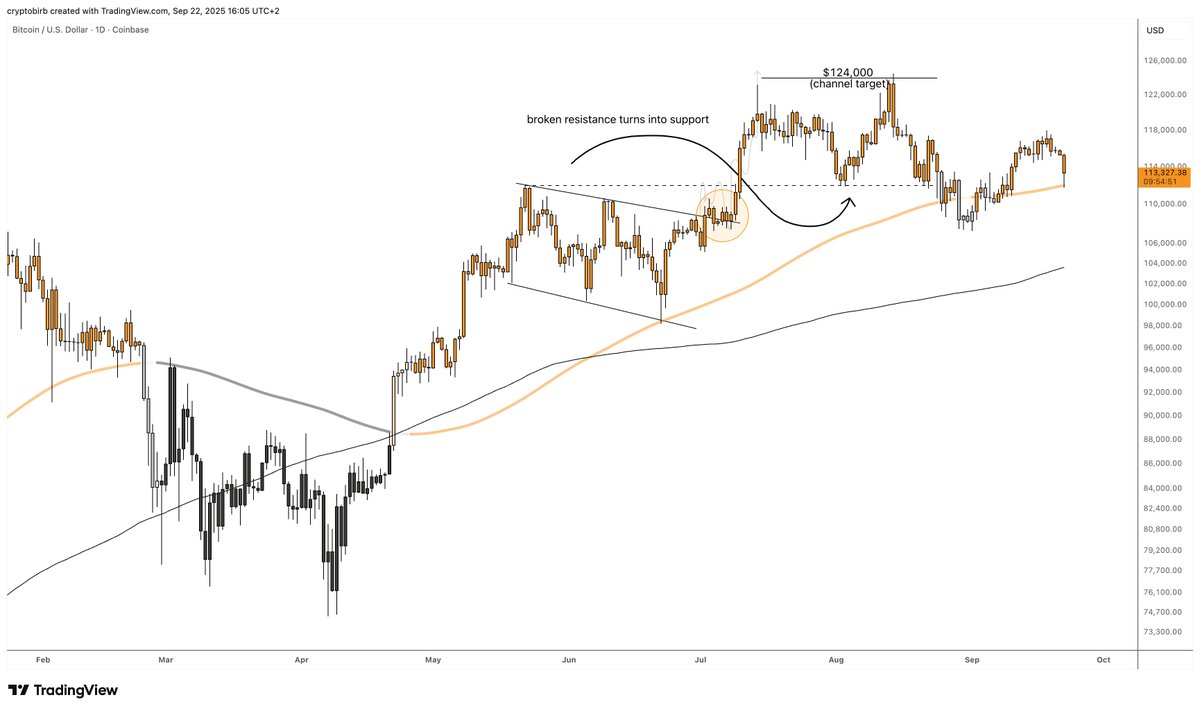
5/ Locally, the magical $20000 level remains the main support level. Traders will often frame their minds at such round numbers, which are easy to remember.
It also coincides with the 200-day mean support, giving traders a reason for magical thinking (buy the support).
It also coincides with the 200-day mean support, giving traders a reason for magical thinking (buy the support).

6/ In fear, traders act irrationally, falling for recency, cognitive dissonance, loss aversion, hindsight, and self-attribution to defend their egos. When markets move up, it’s their genius. When it dips, they’ll blame easy outside targets, politicians, influencers, or weather.

7/ The 9-year seasonal review suggests that March is consistently a bearish and losing month. With -64.39% annualized return and only 33.33% winning trades, #BTC investors should not put much trust in this month being bullish.

8/ On the contrary, the 11-year “Sell in May and Go Away” pattern proves strongly favorable odds for traders waiting to bid on the bullish April-May odds. The annualized return of +202.53% with over 72% winning trades gives an optimistic outlook for the next two months.
However,
However,

9/ Following a sharp increase in mining difficulty over the last few weeks, the average production costs of a #Bitcoin block have jumped over $27000.
That puts miners under severe pressure again, as $BTC trades closer to $20000.
That puts miners under severe pressure again, as $BTC trades closer to $20000.

10/ Overall, #Bitcoin is now exposed to selling pressures, reinforced by the #SVBCollapse, inducing fears around the de-pegging of USDC.
Upon individual risk preferences, it is recommended not to be exposed to big investment risks ahead of the more bullish April-May season.
Upon individual risk preferences, it is recommended not to be exposed to big investment risks ahead of the more bullish April-May season.
11/ On a more personal note, I found the $20000 support area attractive enough to add $50000 worth of $BTC to my long-term holdings.
My main trading account is waiting in cash until a trend breakout signal is confirmed by abnormal volatility.
My main trading account is waiting in cash until a trend breakout signal is confirmed by abnormal volatility.
https://twitter.com/crypto_birb/status/1634354449417379840?s=20
12/ TIP:
If you want to know why 2023 should give multiple strong rallies for $BTC, check out the thread below
If you want to know why 2023 should give multiple strong rallies for $BTC, check out the thread below
https://twitter.com/crypto_birb/status/1632100640125079553?s=20
13/ You might also want to watch this $BTC video explanation for why you should not ignore the long-term trends.
14/ Even though $BTC has dropped $2000 since this video was published, the long-term trend shift suggests it is no longer the old 2022 bear. Learn why👇
15/ Before I go, you still have a chance to celebrate our discounted trading bundle launch in four days and win free $100 or a limited hoodie (1 of 100).
All you need to do is Like, Retweet, and Comment on the tweet below. Do it👊
All you need to do is Like, Retweet, and Comment on the tweet below. Do it👊
https://twitter.com/crypto_birb/status/1633563924023894016?s=20
16/ BONUS:
Here's how buying $BTC in April and selling in May could give a staggering 1000% profit!
Here's how buying $BTC in April and selling in May could give a staggering 1000% profit!
17/ BOOM!
Congratulations!
By studying this thread, you've given yourself a chance to become a winner among 90% of traders who constantly lose money.
If you enjoy following my works, consider sharing the tweet below to help others learn, too!
Thanks🧡
Congratulations!
By studying this thread, you've given yourself a chance to become a winner among 90% of traders who constantly lose money.
If you enjoy following my works, consider sharing the tweet below to help others learn, too!
Thanks🧡
https://twitter.com/crypto_birb/status/1634663467952095233?s=20
18/ “If only there was a good rule of thumb to make money”
I've found there is one bet you can never lose.
110% guaranteed.
In four days, you'll get the last chance to learn this👇
I've found there is one bet you can never lose.
110% guaranteed.
In four days, you'll get the last chance to learn this👇
• • •
Missing some Tweet in this thread? You can try to
force a refresh