Bollinger Band is a popular indicator among traders and investors.
𝗔 𝘁𝗵𝗿𝗲𝗮𝗱 🧵 𝗼𝗻 𝗕𝗼𝗹𝗹𝗶𝗻𝗴𝗲𝗿 𝗕𝗮𝗻𝗱
RETWEET ♻ if you find it useful
Course Worth: ₹25K-₹30K
@Stocktwit_IN @kuttrapali26 @KommawarSwapnil @caniravkaria @Jagadeesh0203
#StockMarket #trading
𝗔 𝘁𝗵𝗿𝗲𝗮𝗱 🧵 𝗼𝗻 𝗕𝗼𝗹𝗹𝗶𝗻𝗴𝗲𝗿 𝗕𝗮𝗻𝗱
RETWEET ♻ if you find it useful
Course Worth: ₹25K-₹30K
@Stocktwit_IN @kuttrapali26 @KommawarSwapnil @caniravkaria @Jagadeesh0203
#StockMarket #trading

📍What is Bollinger Band?
Bollinger Bands is an indicator that was developed by John Bollinger to generate oversold or overbought signals.
Three lines compose Bollinger Bands: A simple moving average, (middle band), and an upper and lower band.
Bollinger Bands is an indicator that was developed by John Bollinger to generate oversold or overbought signals.
Three lines compose Bollinger Bands: A simple moving average, (middle band), and an upper and lower band.
When the price continually touches the upper Bollinger Band, it can indicate an overbought signal.
And, if the price continually touches the lower band it can indicate an oversold signal.
And, if the price continually touches the lower band it can indicate an oversold signal.
📍Bollinger Band Squeeze breakout strategy
When the price consolidates within a small range, Bollinger's band becomes squeezed. After the BB squeeze breakout, the price normally moves quickly in the same direction as the breakout.
When the price consolidates within a small range, Bollinger's band becomes squeezed. After the BB squeeze breakout, the price normally moves quickly in the same direction as the breakout.
In the image below, we can see BB becomes flat and then after BB breakout, we can see a huge upside rally as marked by the yellow arrow in the image below.

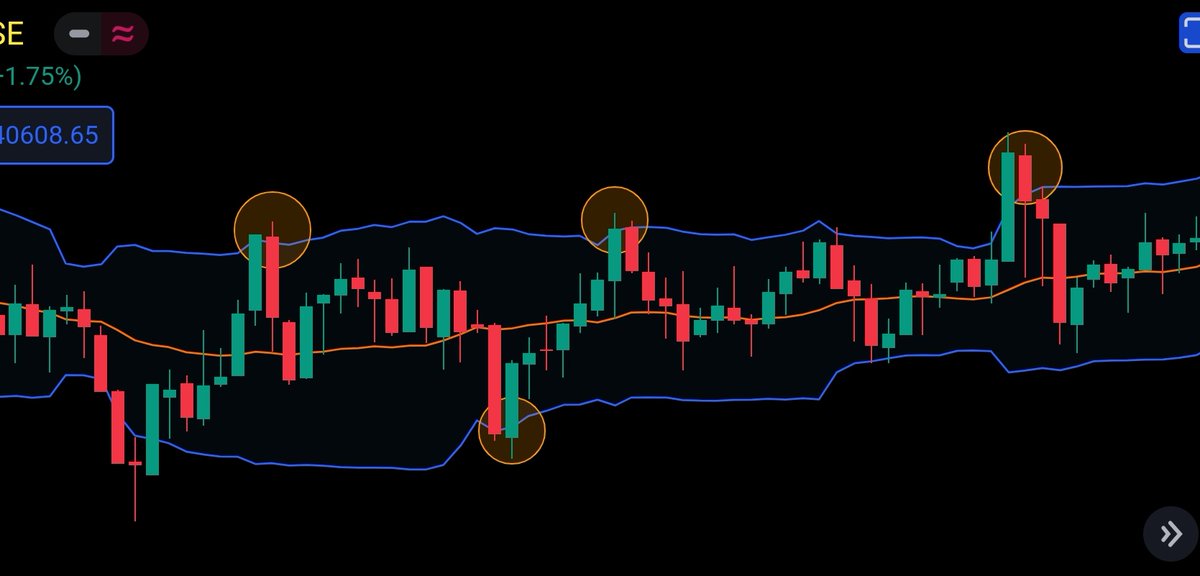
📍Candle outside Bollinger Band
When a candle's open, close, high and low are outside BB, we can expect a reversal from that position.
When a candle's (rectangle box) OHLC is outside lower BB, we can see an upside movement as marked by the yellow arrow in the image below.
When a candle's open, close, high and low are outside BB, we can expect a reversal from that position.
When a candle's (rectangle box) OHLC is outside lower BB, we can see an upside movement as marked by the yellow arrow in the image below.

When a candle's(Rectangle box) OHLC is outside the upper Bollinger band, we can see a downside move as marked by the yellow arrow in the image below.
Higher the timeframe, the better the result.
Higher the timeframe, the better the result.

📍Bollinger Band trap strategy
This strategy works well in a sideways market
If price is moving in a range and then a sudden downfall happens and the candle closes outside BB and immediately a bullish candle forms, then we can expect an upmove as shown in the image below.
This strategy works well in a sideways market
If price is moving in a range and then a sudden downfall happens and the candle closes outside BB and immediately a bullish candle forms, then we can expect an upmove as shown in the image below.

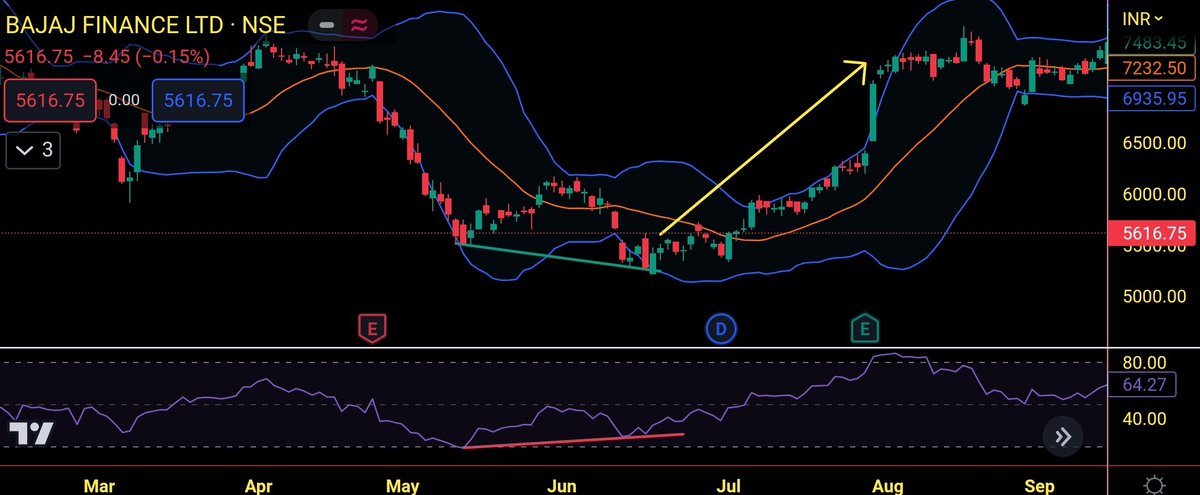
📍Bollinger band + Divergence
When there is a bullish divergence at the lower Bollinger band, the price will reverse and move upside as shown in the image below by the yellow arrow.
When there is a bullish divergence at the lower Bollinger band, the price will reverse and move upside as shown in the image below by the yellow arrow.
On the other hand, when there is a bearish divergence at the upper Bollinger band, the price will reverse and move downside as shown in the image below by the yellow arrow.
Higher the timeframe, the better the result.
Higher the timeframe, the better the result.

📍Bollinger Band Expiry strategy
On expiry day, look for a 30-40 Rs premium on the options chart. If Bollinger band becomes flat and gives breakout after 1:30, take entry with 20 points Stop loss.
On expiry day, look for a 30-40 Rs premium on the options chart. If Bollinger band becomes flat and gives breakout after 1:30, take entry with 20 points Stop loss.
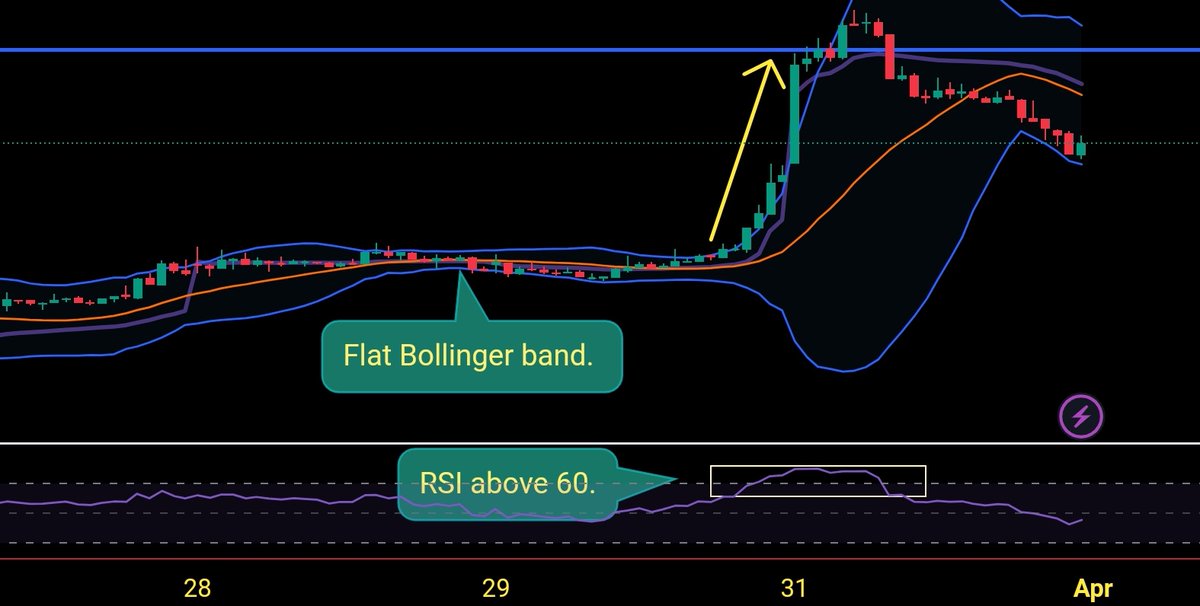
📍Bollinger Band + Vwap + RSI intraday strategy
When BB becomes flat, it indicates strong movement is coming. After upper BB breakout with RSI above 60 and candle open and close above Vwap, we can see a quick upside movement as shown in the image below by the yellow arrow.
When BB becomes flat, it indicates strong movement is coming. After upper BB breakout with RSI above 60 and candle open and close above Vwap, we can see a quick upside movement as shown in the image below by the yellow arrow.
In the image below, we can see a flat Bollinger band and after the Lower Bollinger breakout with RSI below 40 and the candle's open and close below vwap, we can see a downside move as marked by the yellow arrow.
Timeframe- 15 min
Timeframe- 15 min

📍Bollinger Band scalping strategy 1
In a sideways market, scalping can be done at the upper and lower Bollinger band for 30-40 points in bank nifty.
At upper Bollinger, buy PE and at lower Bollinger band, buy CE.
Timeframe- 3 mins.
In a sideways market, scalping can be done at the upper and lower Bollinger band for 30-40 points in bank nifty.
At upper Bollinger, buy PE and at lower Bollinger band, buy CE.
Timeframe- 3 mins.
📍Bollinger band scalping strategy 2
When a shooting star candle forms at Upper Bollinger band, we can see a downward movement as shown in the below image.
Works better in a sideways market.
When a shooting star candle forms at Upper Bollinger band, we can see a downward movement as shown in the below image.
Works better in a sideways market.

📍Bollinger Band scalping strategy 3
When a hammer candle forms at the lower Bollinger band, we can see an upside movement as shown in the below image.
Works better in a sideways market.
When a hammer candle forms at the lower Bollinger band, we can see an upside movement as shown in the below image.
Works better in a sideways market.

📍Other uses of Bollinger band.
• BB acts as Support and Resistance. Especially works at classic support and resistance.
• When BB is parallel, price is less unlikely to stay outside BB. Buy at LBB and sell at UBB. BB becomes parallel usually after a big uptrend or downtrend.
• BB acts as Support and Resistance. Especially works at classic support and resistance.
• When BB is parallel, price is less unlikely to stay outside BB. Buy at LBB and sell at UBB. BB becomes parallel usually after a big uptrend or downtrend.
• Two candle pattern Engulfing/ Tweezer bottom at Lower Bollinger band is a bullish signal. Engulfing/Tweezer top at Upper Bollinger band is a bearish signal.
📍Bollinger Band scanner
Congratulations on making till here.
Here's a Bollinger band squeeze scanner for you.
chartink.com/screener/bolli…
Congratulations on making till here.
Here's a Bollinger band squeeze scanner for you.
chartink.com/screener/bolli…
That's a wrap!
If you enjoyed this thread:
1. Follow @me__kaushik for more threads relating to trading.
2. RT the first tweet of this thread for maximum reach.
Also, join our FREE telegram channel for live market trades. t.me/thetradingcirc…
If you enjoyed this thread:
1. Follow @me__kaushik for more threads relating to trading.
2. RT the first tweet of this thread for maximum reach.
Also, join our FREE telegram channel for live market trades. t.me/thetradingcirc…
• • •
Missing some Tweet in this thread? You can try to
force a refresh