BIG NEWS: #ChatGPT breaks #Python vs #R Barriers in Data Science!
Data science teams everywhere rejoice.
A mind-blowing thread (with a FULL chatgpt prompt walkthrough). 🧵
#datascience #rstats
Data science teams everywhere rejoice.
A mind-blowing thread (with a FULL chatgpt prompt walkthrough). 🧵
#datascience #rstats
It's NOT R VS Python ANYMORE!
This is 1 example of how ChatGPT can speed up data science & GET R & PYTHON people working together.
(it blew my mind)
This is 1 example of how ChatGPT can speed up data science & GET R & PYTHON people working together.
(it blew my mind)
This example combines #R, #Python, and #Docker.
I created this example in under 10 minutes from start to finish.
I created this example in under 10 minutes from start to finish.
I’m an R guy.
And I prefer doing my business research & analysis in R.
It's awesome. It has:
1. Tidyverse - data wrangling + visualization
2. Tidymodels - Machine Learning
3. Shiny - Apps
And I prefer doing my business research & analysis in R.
It's awesome. It has:
1. Tidyverse - data wrangling + visualization
2. Tidymodels - Machine Learning
3. Shiny - Apps
But the rest of my team prefers Python.
And they don't like R... it's just weird to them.
So I wanted to see if I could show them how we could work together...
And they don't like R... it's just weird to them.
So I wanted to see if I could show them how we could work together...
Let’s start with a prompt.
I asked chatgpt to find a data set that I used for this example.
I asked chatgpt to find a data set that I used for this example.

...ChatGPT found it...

... And gave me this code to read the data...

I prefer the tidyverse, so I asked Chatgpt to update the code.
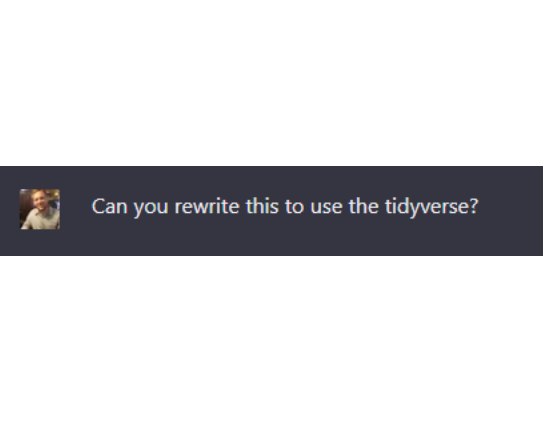
That looks better.

With the data in hand, it’s time for some Data Science.
I asked this simple question.
I asked this simple question.

ChatGPT's response was impressive.

But, even though I’m an R guy, my team uses Python for Deployment…
In the past, that’s a huge problem.
(resulting in days of translations from R to Python with Google and StackOverflow)
In the past, that’s a huge problem.
(resulting in days of translations from R to Python with Google and StackOverflow)
But now, that’s 1 minute of effort with chatGPT.
Can I show you?
Can I show you?
I asked chatgpt to convert the R script to python...

And in 10 seconds chatgpt made this python code with pandas and scikit learn.

ChatGPT did in 10 seconds something that would have taken me 2 hours.
But let’s continue.
The reason we had to convert to Python is for “deployment”
Deployment is just a fancy word for allowing others to access my model so they can use it on-demand.
But let’s continue.
The reason we had to convert to Python is for “deployment”
Deployment is just a fancy word for allowing others to access my model so they can use it on-demand.
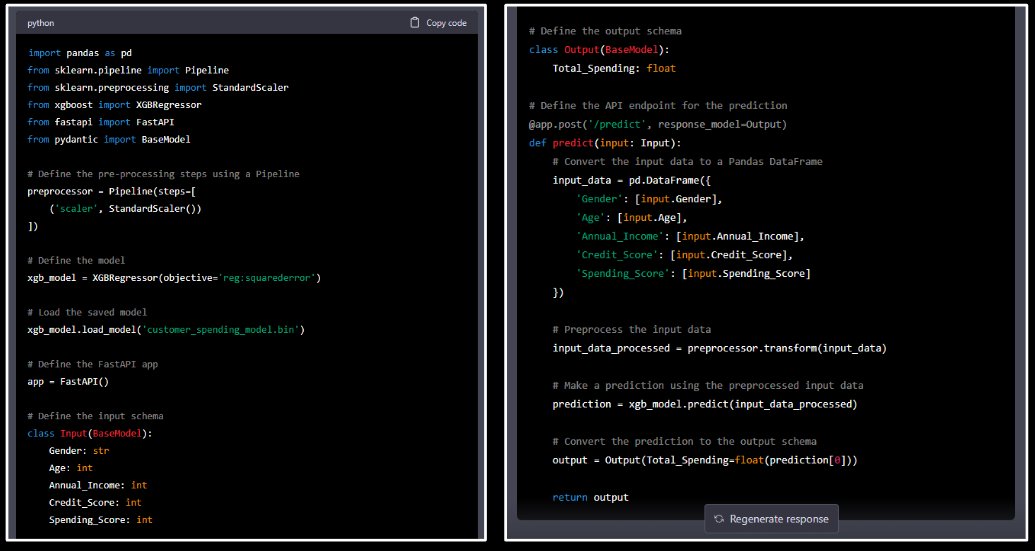
So I asked chatGPT this:
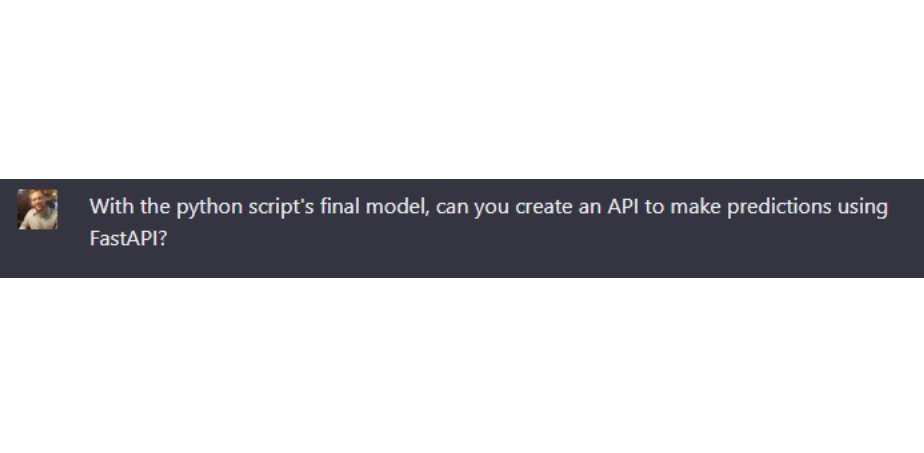
And ChatGPT made me a Python API using FastAPI.
But this code is useless…
… Without a docker environment.
So I asked chatGPT to make one:
… Without a docker environment.
So I asked chatGPT to make one:

And chatGPT delivered my Docker Environment's Dockerfile:

So in under 10 minutes, I had ChatGPT:
1. Make my research script in R.
2. Create my production script in Python for my Team
3. And create the API + Docker File to deploy it.
1. Make my research script in R.
2. Create my production script in Python for my Team
3. And create the API + Docker File to deploy it.
But when I showed my Python team, instead of excited...
...They were worried.
And I said, "Listen. There's nothing to be afraid of."
"ChatGPT is a productivity enhancer."
They didn't believe me.
...They were worried.
And I said, "Listen. There's nothing to be afraid of."
"ChatGPT is a productivity enhancer."
They didn't believe me.
My Conclusion:
You have a choice. You can rule AI.
Or, you can let AI rule you.
What do you think the better choice is?
You have a choice. You can rule AI.
Or, you can let AI rule you.
What do you think the better choice is?
If you want help, I'd like you to join me on a free #ChatGPT for #DataScientists Workshop on April 26th. And I will help you Rule AI.
What's the next step?
👉Register Here: us02web.zoom.us/webinar/regist…
What's the next step?
👉Register Here: us02web.zoom.us/webinar/regist…

• • •
Missing some Tweet in this thread? You can try to
force a refresh