𝐀 𝐏𝐨𝐬𝐢𝐭𝐢𝐨𝐧𝐚𝐥 𝐓𝐫𝐚𝐝𝐢𝐧𝐠 𝐒𝐭𝐫𝐚𝐭𝐞𝐠𝐲 𝐰𝐡𝐢𝐜𝐡 𝐖𝐨𝐫𝐤𝐬 𝐚𝐧𝐝 𝐌𝐚𝐤𝐞𝐬 𝐌𝐨𝐧𝐞𝐲 𝐟𝐨𝐫 𝐦𝐞!
A Master Thread with "𝐂𝐚𝐬𝐞 𝐒𝐭𝐮𝐝𝐢𝐞𝐬"!🧵👇
A Master Thread with "𝐂𝐚𝐬𝐞 𝐒𝐭𝐮𝐝𝐢𝐞𝐬"!🧵👇
Case Study (1)
Below mentioned chart is the daily chart of Ambuja Cement showing how it performed after the entry was taken and where we would have taken exit.
Do read the exit rule written in the image.
In this example I am using 50 DEMA as a exit rule.

Below mentioned chart is the daily chart of Ambuja Cement showing how it performed after the entry was taken and where we would have taken exit.
Do read the exit rule written in the image.
In this example I am using 50 DEMA as a exit rule.


Case Study (2)
Below given chart is the daily chart of granules india and forming up bullish continuation pattern.
A strong Breakout occurred which signified strong bullishness and we would have place our stop loss just below tight buildup price action.
Below given chart is the daily chart of granules india and forming up bullish continuation pattern.
A strong Breakout occurred which signified strong bullishness and we would have place our stop loss just below tight buildup price action.

Case Study(3)
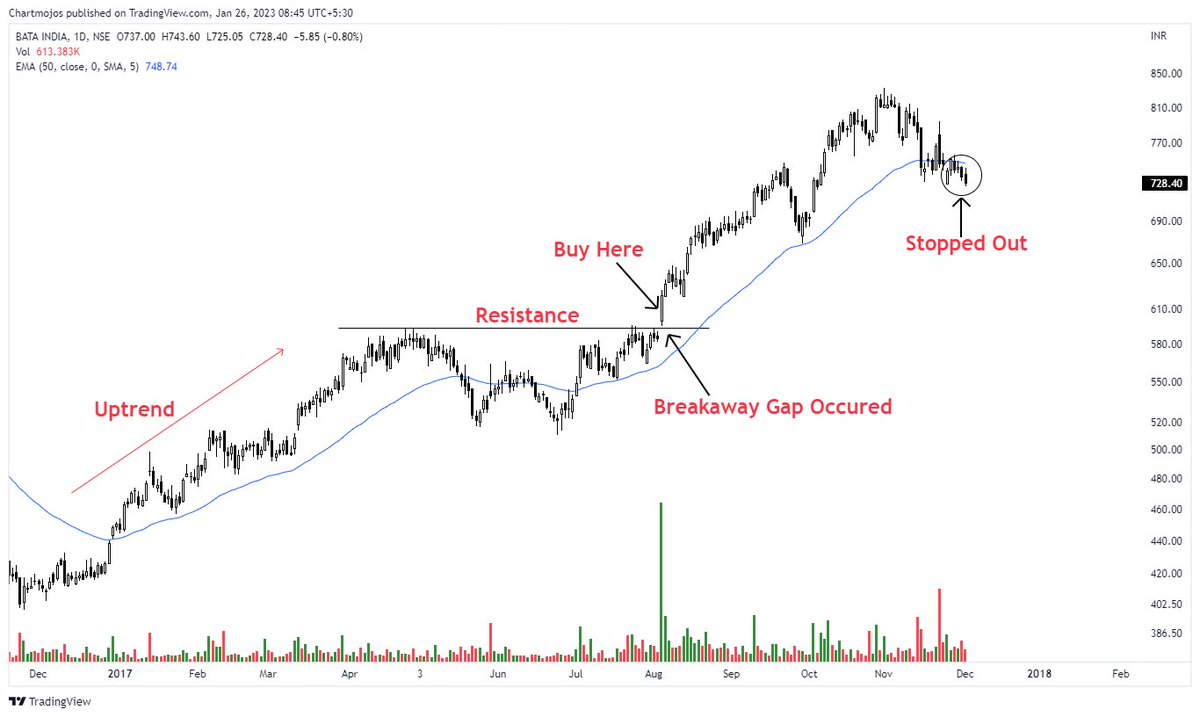
The graphic below is the daily chart of bata india showing C&H Continuation pattern which happened with breakaway gap.
I have also mentioned where we will take entry and put our stop loss and get stopped out.
Do read exit rule given in the 1st case study image.
The graphic below is the daily chart of bata india showing C&H Continuation pattern which happened with breakaway gap.
I have also mentioned where we will take entry and put our stop loss and get stopped out.
Do read exit rule given in the 1st case study image.

Case Study (4)
Below given chart is the daily chart of Bharat Electronic, forming up symmetrical pattern.
A strong BO Candle occurred which signified strong upside and mentioned the place where would have placed our SL and gotten stopped out.
Here, I have used ATR as SL.
Below given chart is the daily chart of Bharat Electronic, forming up symmetrical pattern.
A strong BO Candle occurred which signified strong upside and mentioned the place where would have placed our SL and gotten stopped out.
Here, I have used ATR as SL.

Case Study (5)
The graphic below is the daily chart of JKLAKSHMI showing trend reversal pattern which happened with strong BO candle.
I have also mentioned where we will take entry and put our stop loss and get stopped out.
Do read exit rule given in the 1st case study image.
The graphic below is the daily chart of JKLAKSHMI showing trend reversal pattern which happened with strong BO candle.
I have also mentioned where we will take entry and put our stop loss and get stopped out.
Do read exit rule given in the 1st case study image.

That's the wrap here!
Remember you can use stop loss in the form of price action based or ATR based.
Do consider volume as well while using this positional trading strategy.
Remember you can use stop loss in the form of price action based or ATR based.
Do consider volume as well while using this positional trading strategy.
If you found the thread helpful than do spread the word.
𝐃𝐨 "𝐑𝐞𝐭𝐰𝐞𝐞𝐭" 𝐭𝐡𝐞 𝐟𝐢𝐫𝐬𝐭 𝐭𝐰𝐞𝐞𝐭.
Happy Reading!
@chartmojo @caniravkaria @jitendrajain @PAlearner @KommawarSwapnil @Puretechnicals9 @BeyondTrading07 @nakulvibhor @PatilBankNifty @Abhishekkar_
𝐃𝐨 "𝐑𝐞𝐭𝐰𝐞𝐞𝐭" 𝐭𝐡𝐞 𝐟𝐢𝐫𝐬𝐭 𝐭𝐰𝐞𝐞𝐭.
Happy Reading!
@chartmojo @caniravkaria @jitendrajain @PAlearner @KommawarSwapnil @Puretechnicals9 @BeyondTrading07 @nakulvibhor @PatilBankNifty @Abhishekkar_
https://twitter.com/sunilgurjar01/status/1649633363764846598
• • •
Missing some Tweet in this thread? You can try to
force a refresh

 Read on Twitter


