Learning data science on your own is tough...

...(ahem, it took me 6 years)

So here's some help.

5 Free Books to Cut Your Time In HALF.

Let's go! 🧵

#datascience #rstats #R Image
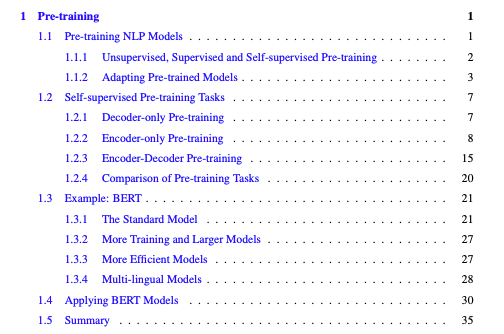
1. Mastering #Spark with #R

This book solves an important problem- what happens when your data gets too big?

For example, analyzing 100,000,000 time series.

You can do it in R with the tools covered in this book.

Website: therinspark.com Image
2. Geocomputation with #R

Interested in #Geospatial Analysis?

This book is my go-to resource for all things geospatial.

This book covers:
-Making Maps
-Working with Spatial Data
-Applications (Transportation, Geomarketing)

Website: r.geocompx.org Image
3. Tidy Finance with #R

What tools exist in R for #Finance?
And how do I use them?

Answers to these questions are covered in this book!

P.S.- This book uses my R package, #tidyquant

Website: tidy-finance.org Image
4. Text Mining with R

This is a fantastic introduction to text analysis and text mining with the #tidytext R package.

This book singlehandedly made me MORE CONFIDENT with text analysis.

Website: tidytextmining.com Image
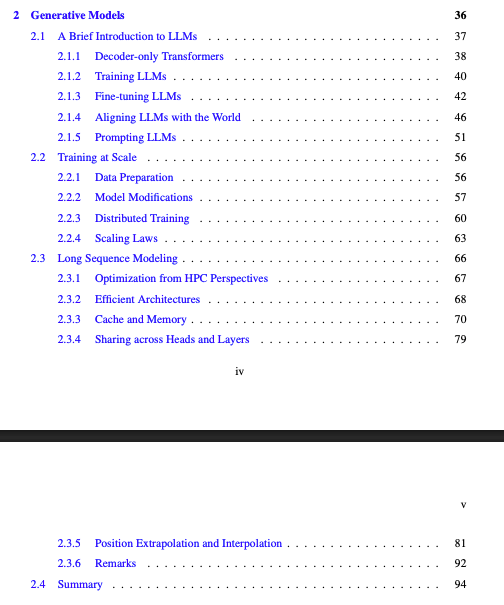
5. #Forecasting Principles and Practice

This is the best “theory” book on #timeseries analysis and forecasting.

Topics Covered:
- ARIMA,
- Exponential Smoothing,
- TimeSeries Decomposition
- A lot more!

Website: otexts.com/fpp3/ Image
1-Dollar Bonus Book:

This is a massive value- Gives you a complete plan for EVERYTHING you need to know about learning data science.

It's only a buck.

And it will cut 2-3 years off your journey.

Website: learn.business-science.io/if-i-had-to-le… Image
Want even more help becoming a 6-figure data scientist?

I have a free workshop that will help you become a $100K+ earner as a #DataScientist even in a Recession.

👉Register Here: us02web.zoom.us/webinar/regist… Image

• • •

Missing some Tweet in this thread? You can try to force a refresh
 

Keep Current with 🔥 Matt Dancho (Business Science) 🔥

🔥 Matt Dancho (Business Science) 🔥 Profile picture

Stay in touch and get notified when new unrolls are available from this author!

Read all threads

This Thread may be Removed Anytime!

PDF

Twitter may remove this content at anytime! Save it as PDF for later use!

Try unrolling a thread yourself!

how to unroll video
  1. Follow @ThreadReaderApp to mention us!

  2. From a Twitter thread mention us with a keyword "unroll"
@threadreaderapp unroll

Practice here first or read more on our help page!

More from @mdancho84

Jun 5
A Python Library for Time Series using Hidden Markov Models.

Let me introduce you to hmmlearn. Image
1. Hidden Markov Models

A Hidden Markov Model (HMM) is a statistical model that describes a sequence of observable events where the underlying process generating those events is not directly visible, meaning there are "hidden states" that influence the observed data, but you can only see the results of those states, not the states themselvesImage
2. HMM for Time Series with hmmlearn

hmmlearn implements the Hidden Markov Models (HMMs).

We can use HMM for time series. Example: Using HMM to understand earthquakes.

Tutorial: hmmlearn.readthedocs.io/en/latest/auto…Image
Read 9 tweets
Jun 4
🚨NEW AI for Data Scientists Workshop

This is what's coming: Image
Generative AI is the future of Data Science.

Those who can build with LLMs and Python have unlimited career potential. Image
To help, I'm going to lift the curtains on one of my BEST AI projects that companies will pay you $$$ for.

Here's what I'll share in the training: Image
Read 7 tweets
Jun 4
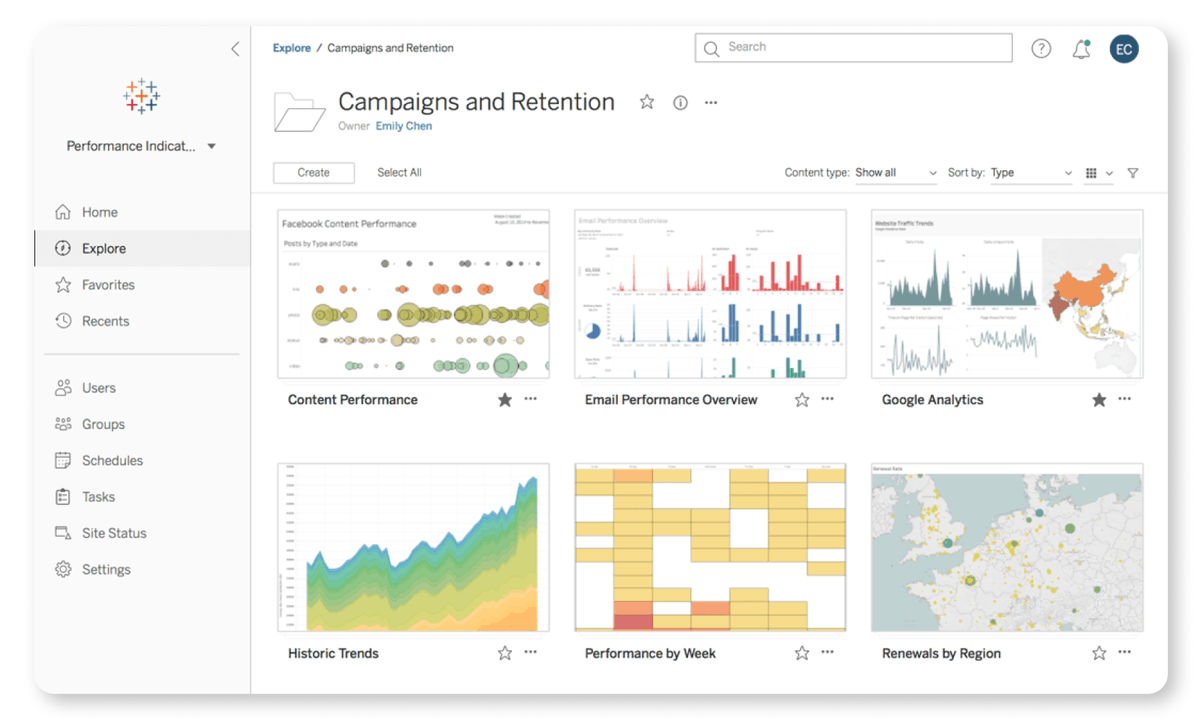
❌Move over PowerBI. There's a new AI analyst in town.

💡Introducing ThoughtSpot. Image
1. AI Analyst

ThoughtSpot’s Spotter is an AI analyst that uses generative AI to answer complex business questions in natural language, delivering visualizations and insights instantly.

It supports iterative querying (e.g., “What’s next?”) without predefined dashboards. Image
2. Self-Service Analytics

Unlike Tableau and Power BI, which rely on structured dashboards, ThoughtSpot emphasizes self-service analytics with a search-based interface, making it accessible to non-technical users.

Its AI-driven approach feels like “ChatGPT for data.” Image
Read 8 tweets
Jun 3
Top 7 most important statistical analysis concepts that have helped me as a Data Scientist.

This is a complete 7-step beginner ROADMAP for learning stats for data science. Let's go: Image
Step 1: Learn These Descriptive Statistics

Mean, median, mode, variance, standard deviation. Used to summarize data and spot variability. These are key for any data scientist to understand what’s in front of them in their data sets. Image
2. Learn Probability

Know your distributions (Normal, Binomial) & Bayes’ Theorem. The backbone of modeling and reasoning under uncertainty. Central Limit Theorem is a must too. Image
Read 12 tweets
Jun 1
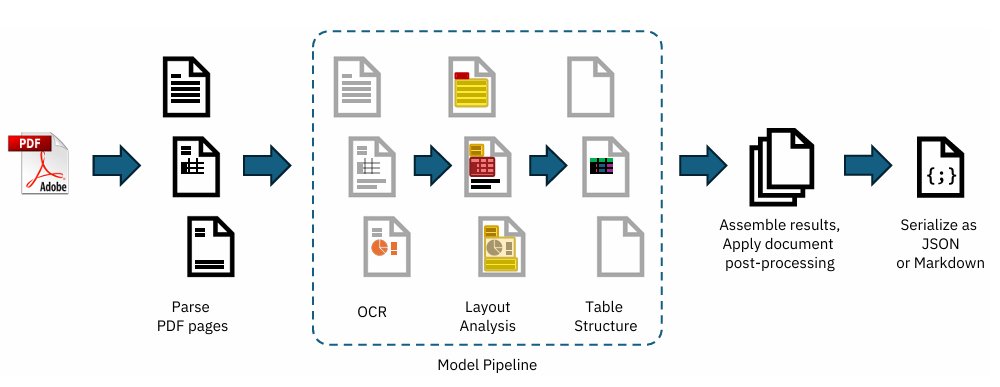
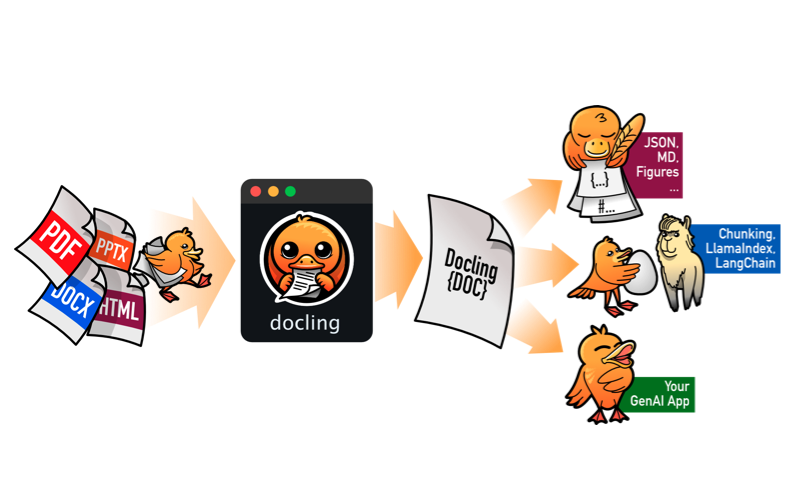
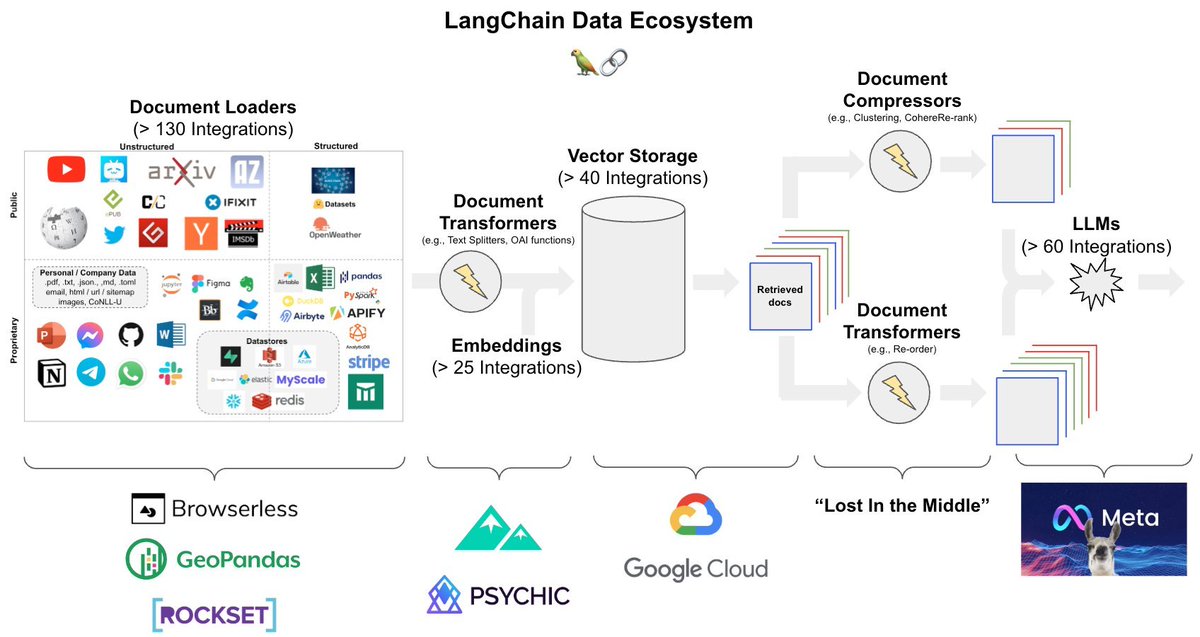
🚨 BREAKING: IBM launches a free Python library that converts ANY document to data

Introducing Docling. Here's what you need to know: 🧵 Image
1. What is Docling?

Docling is a Python library that simplifies document processing, parsing diverse formats — including advanced PDF understanding — and providing seamless integrations with the gen AI ecosystem. Image
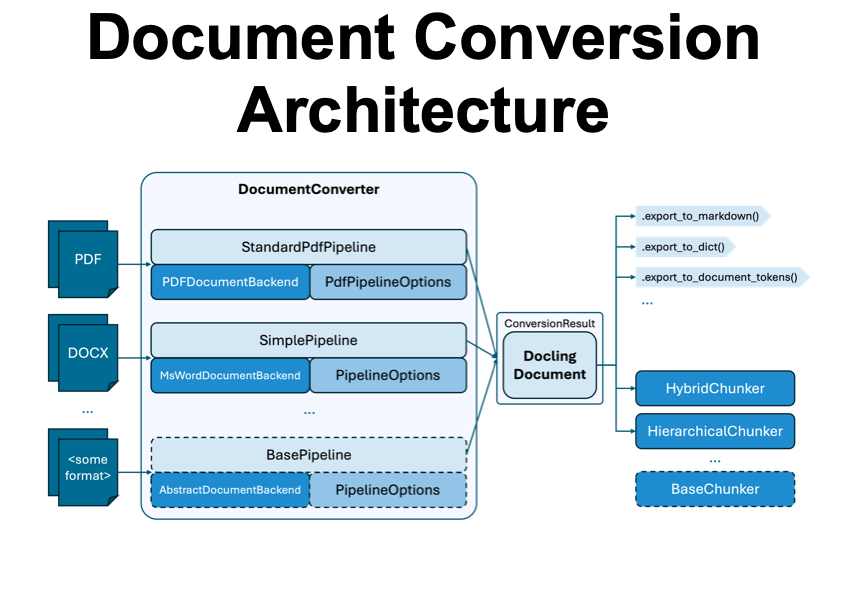
2. Document Conversion Architecture

For each document format, the document converter knows which format-specific backend to employ for parsing the document and which pipeline to use for orchestrating the execution, along with any relevant options. Image
Read 9 tweets
May 30
The concept that helped me go from bad models to good models: Bias and Variance.

In 4 minutes, I'll share 4 years of experience in managing bias and variance in my machine learning models. Let's go. 🧵 Image
1. Generalization:

Bias and variance control your models ability to generalize on new, unseen data, not just the data it was trained on. The goal in machine learning is to build models that generalize well. To do so, I manage bias and variance. Image
2. Low vs High Bias:

Models with low bias are usually complex and can capture the underlying patterns in data very well. They are flexible enough to fit the training data closely. Models with high bias are overly simple and cannot capture the complexity in the data. They often underfit the training data, meaning they perform poorly even on the data they were trained on.Image
Read 13 tweets

Did Thread Reader help you today?

Support us! We are indie developers!


This site is made by just two indie developers on a laptop doing marketing, support and development! Read more about the story.

Become a Premium Member ($3/month or $30/year) and get exclusive features!

Become Premium

Don't want to be a Premium member but still want to support us?

Make a small donation by buying us coffee ($5) or help with server cost ($10)

Donate via Paypal

Or Donate anonymously using crypto!

Ethereum

0xfe58350B80634f60Fa6Dc149a72b4DFbc17D341E copy

Bitcoin

3ATGMxNzCUFzxpMCHL5sWSt4DVtS8UqXpi copy

Thank you for your support!

Follow Us!

:(